
Stocks slipped into correction mode last week, with the S&P 500 falling more than 10% from its peak in mid-February. It took only 16 trading sessions for the S&P to sink 10%, marking the seventh-fastest correction since 1929. Three of the fastest seven drawdowns have happened under President Trump: 2018, 2020 and now.
Some important things to know about corrections:
• The S&P has averaged 1.1 corrections per year since 1928.
• Corrections happen for a reason, and stocks have always fully recovered.
• Emotions run high during corrections, and many investors are prone to making costly investment mistakes out of fear that the correction will worsen and stocks won’t bounce back.
• The best defense against corrections is to remember that they are normal, even in good stock markets.
S&P 500 Enters Correction Territory
The gauge fell 1.4% Thursday, bringing its three-week rout past 10%
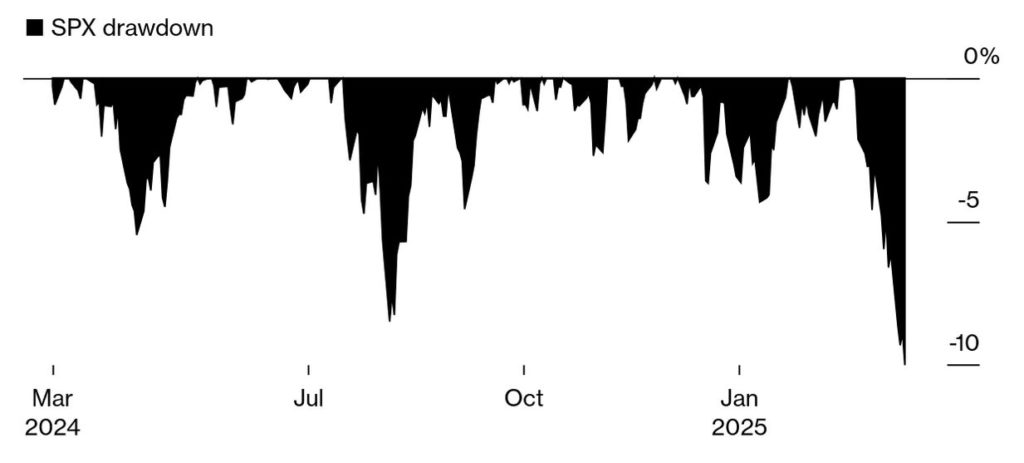
Corrections feel different every time, and they never feel normal – but they are. We are in a trade war with uncertainty all around us, and markets do not like uncertainty.
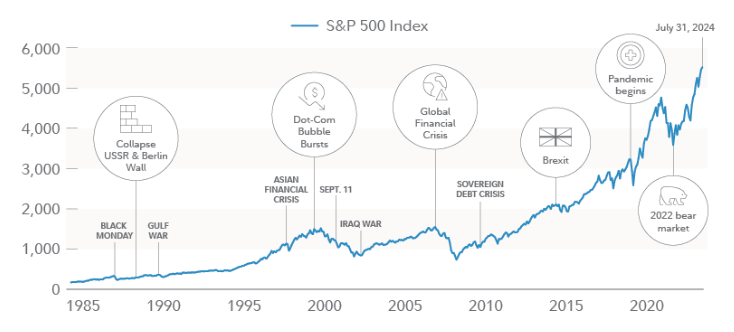
Investors tend to rationalize in a negative context, thinking that the current situation is different from previous corrections. It’s natural to fear the worst. The chart below is a great reminder that throughout history, the U.S. economy and stock market have faced many obstacles and still have gone on to thrive.
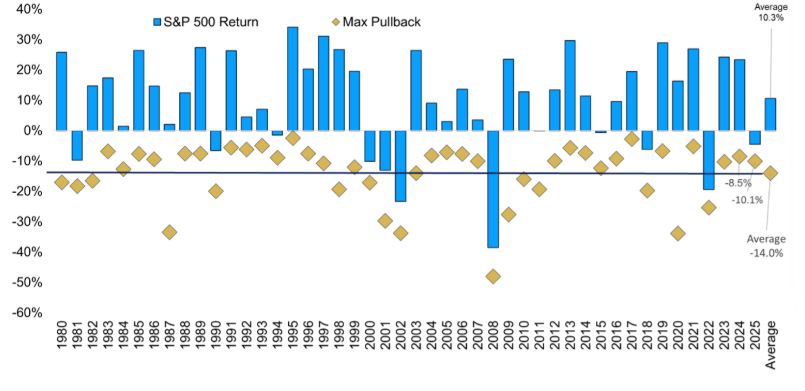
Since 1980, the S&P 500 has dropped 5% or more in nearly every year (93% of the time) and 10% or more in almost half of the years (47%). The current correction is the 24th in 46 years, meaning a 10% drop happens more often than not.
Despite that, most years still end positively. Only nine out of those 46 years ended with losses. In 16 of the 24 correction years, the market avoided a bear market (a 20% drop) and still delivered an average return of 9.5%, which matches the long-term average since 1950. Since World War II, there have been 48 corrections, but only 12 turned into bear markets — a relatively low number.
Putting 2025 in Perspective
S&P 500 Index max pullback per calendar year
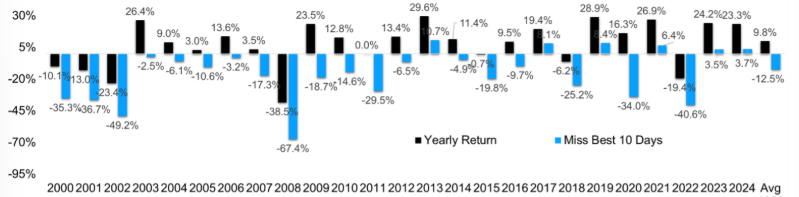
The chart below reminds us that what matters most is time in the market — and not time out of the market. The best and worst days of the year often are close to each other, so if you sell on the bigger down days, you will be more likely to miss the bigger up days to help you recover. We saw this last week; Monday was the worst day of the year, and Friday was the best day of the year.
In 2024, the S&P was up more than 23% on the year. If you missed the best 10 days, your return was less than 4%! (The same was true for 2023.) Since 2000, the average return for the S&P has been 9.5%, but if you were to miss the best 10 days, the return would be -12.5%!
Missing the Best 10 Days of the Year Can Crush Returns
S&P 500 yearly returns (2000-2024)
We know that this correction and recent market volatility don’t feel good. Understanding the market’s history is important when you are making decisions about how to achieve your long-term investing goals.
While we don’t know how long the market pullback may last — whether it is short-lived or the start of a longer market drawdown — history shows that the stock market recovers, and diversified investment portfolios help withstand volatility and tough market times.
The CD Wealth Formula
We help our clients reach and maintain financial stability by following a specific plan, catered to each client.
Our focus remains on long-term investing with a strategic allocation while maintaining a tactical approach. Our decisions to make changes are calculated and well thought out, looking at where we see the economy is heading. We are not guessing or market timing. We are anticipating and moving to those areas of strength in the economy — and in the stock market.

We will continue to focus on the fact that what really matters right now is time in the market, not out of the market. That means staying the course and continuing to invest, even when the markets dip, to take advantage of potential market upturns. We continue to adhere to the tried-and-true disciplines of diversification, periodic rebalancing and looking forward, while not making investment decisions based on where we have been.
It is important to focus on the long-term goal, not on one specific data point or indicator. Long-term fundamentals are what matter. In markets and moments like these, it is essential to stick to the financial plan. Investing is about following a disciplined process over time.
Sources: Bloomberg, Carson, CNBC, Fidelity


