Here’s What You Should Know About Asset Allocations and Volatility

Last Friday, stocks capped off a volatile week of trading after the previous day’s release of the Consumer Price Index (CPI) for September came in hotter than expected. Initially, this weighed on the markets as investors braced for the Federal Reserve to continue aggressively raising rates. After the release of the CPI report on Thursday, the S&P 500 opened down more than 2.4%, but by the end of the day, we had witnessed the fifth-largest intraday reversal from a low. The S&P 500 ended up 2.6% Thursday, reinforcing just how volatile this market is – much like previous bear markets. Then on Friday, the S&P gave back the gains from the day before, ending down 1.55% for the week.

The increase in volatility is not just in the stock market. Volatility has spiked in a range of markets from currencies to bonds, raising concern about the ability of the global economy to cope with higher U.S. rates. If these trends continue, the Fed may moderate its pace of tightening and slow the pace of reducing its balance sheet. The dollar has surged to new all-time highs on a trade-weighted basis, driven by a combination of relatively high U.S. yields and demand for safe-haven assets during global political turmoil. Fed officials have made it clear that financial market volatility alone will not affect their rate decisions.

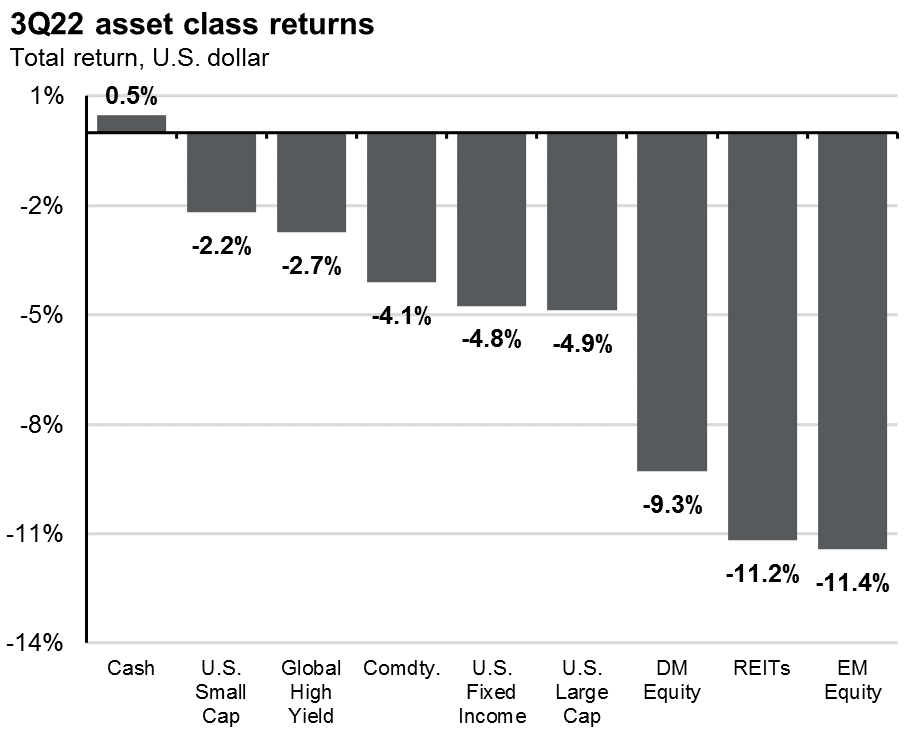
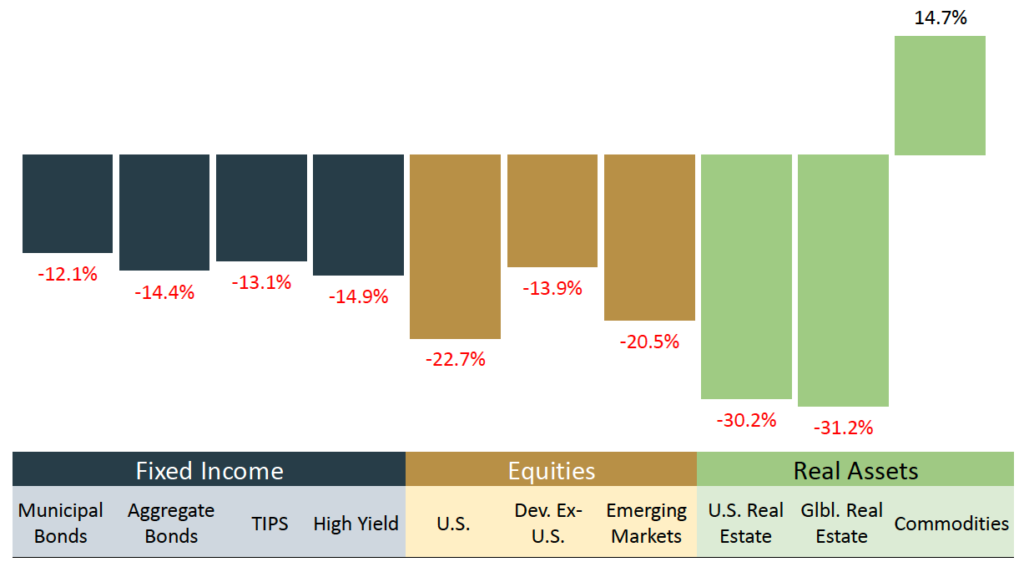
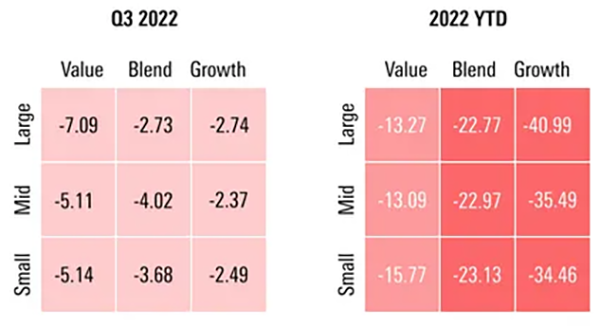
As seen in the bar chart below, the only positive asset class other than cash through the first three quarters of the year has been commodities. (And gold, the most well-known commodity, is down almost 10% year to date.) In some instances, bonds are down as much as stocks this year. This begs the question: Is asset allocation dead? Does the old-style box chart investing —allocating money into growth and value, small cap, mid cap, large cap and international stocks as well as in bonds, as seen in the second chart below — not work anymore? 

U.S. Markets YTD % Returns

Chart showing U.S. Markets year to date returns
Past performance is not a reliable indicator of current or future results. Indexes are unmanaged and not subject to fees. It is not possible to invest directly in an index. Note: Views are from a U.S. dollar perspective. Source: Kestra Investment Management with data from FactSet. Index proxies: Bloomberg Municipal Bond Index, Bloomberg US Aggregate, Bloomberg US Treasury Inflation Protected Notes (TIPS), Bloomberg US High Yield-Corporate, S&P 500, MSCI World ex USA, MSCI EM, Dow Jones US Select REIT, Dow Jones Global X US, and Bloomberg Commodity Index. Data as of September 29, 2022.

U.S. Equity Style Box Performance

Chart showing U.S. Equity Style Box Performance
Source: Morningstar Direct, Morningstar Indexes. Data as of September 30, 2022.

For investors whose experience this year has them questioning asset allocation, the following may provide perspective on why we believe it remains effective.

What we have seen in 2022 is unusual. The aggregate bond index (AGG) has been around since 1976. Since that time, the index has been negative four times, the worst being a decline of 2.9% in 1994. In each of those years, the S&P 500 has been higher by an average of more than 20%. This year appears to be an anomaly.
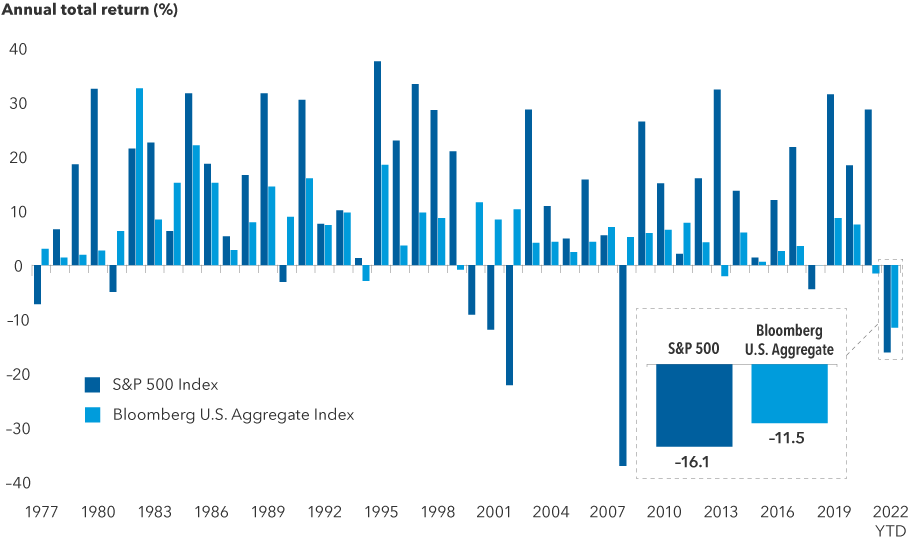
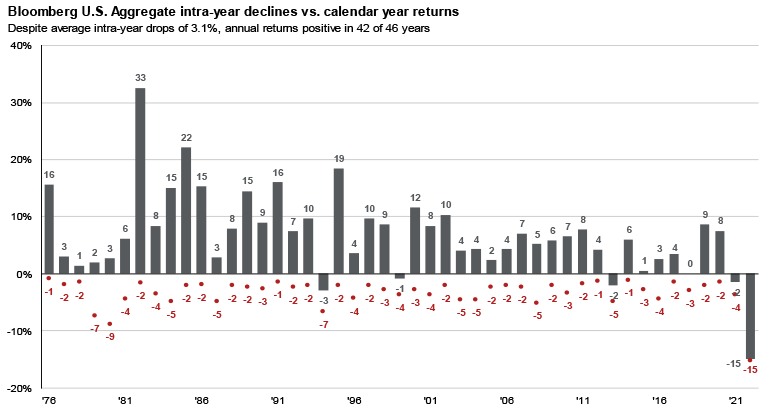
The picture is more complicated on a quarterly basis. Since 1970, the S&P 500 has had 50 negative quarters, and the AGG has been lower in 16 of them. During the worst quarter of 2008, when stocks were down the most, the AGG was up. The third quarter of 1981 had been the worst quarter for the AGG until the second quarter of this year. The chart below shows the AGG’s total return each year. The red dots show the largest peak-to-trough decline each year. The average intra-year decline has been 3.2% versus an average decline of 14% for stocks. Historically, after bad years of performance, bonds tend to deliver strong returns in the years that follow.

Bloomberg U.S. Aggregate Annual Returns and Intra-Year Declines

Chart showing U.S. Aggregate intra-year declines
Sources: Bloomberg, FactSet, JP Morgan Asset Management. Returns are based on total return. Intra-year drops refers to the largest market drops from a peak to a trough during the year. For illustrative purposes only. Returns shown are calendar year returns from 1976 to 2021, over which time period the average annual return was 7.1%. Returns from 1076 to 1989 are calculated on a monthly basis; daily data are used afterwards. Guide to the Markets — U.S. Data are as of September 30, 2022.

Bonds can go down as well as stocks. The historical correlation between the S&P 500 and the AGG is close to zero. Stocks and bonds tend to each go their own ways relative to performance, rather than moving in decidedly opposite directions. It is also important to remember that bonds, like stocks, can and will go down, especially in an environment of rising interest rates. 

Dislocations can create opportunities. We do not think that traditional asset allocation is dead. While all but cash and commodities are negative this year, stock and bond valuations have improved. Diversification within stocks and bonds will continue to add value to a portfolio. Vanguard’s chief economist for the Americas, Roger Aliaga-Diaz, recently commented that “market volatility means diversified portfolio returns will always remain uneven, comprising periods of higher or lower – and, yes, even negative returns.” He went on to add:

“The broader, more important issue is the effectiveness of a diversified portfolio, balanced across asset classes, in keeping with the investor’s risk tolerance and time horizon.”

The CD Wealth Formula

We help our clients reach and maintain financial stability by following a specific plan, catered to each client. 

Our focus remains on long-term investing with a strategic allocation while maintaining a tactical approach. Our decisions to make changes are calculated and well thought out, looking at where we see the economy is heading. We are not guessing or market timing. We are anticipating and moving to those areas of strength in the economy — and in the stock market. 

We will continue to focus on the fact that what really matters right now is time in the market, not out of the market. That means staying the course and continuing to invest, even when the markets dip, to take advantage of potential market upturns. We continue to adhere to the tried-and-true disciplines of diversification, periodic rebalancing and looking forward, while not making investment decisions based on where we have been.

It is important to focus on the long-term goal, not on one specific data point or indicator. Long-term fundamentals are what matter.  In markets and moments like these, it is essential to stick to the financial plan. Investing is about following a disciplined process over time.

Sources:  Kestra Investment Management, Morningstar, CNBC, Vanguard, JP Morgan

Promo for article titled Worried About Retirement in a Down Market? Consider These Strategies

This material contains an assessment of the market and economic environment at a specific point in time and is not intended to be a forecast of future events, or a guarantee of future results. Forward-looking statements are subject to certain risks and uncertainties. Actual results, performance, or achievements may differ materially from those expressed or implied. Information is based on data gathered from what we believe are reliable sources.

Using diversification as part of your investment strategy neither assures nor guarantees better performance and cannot protect against loss of principal due to changing market conditions.

Past performance is not a guarantee of future results.

The opinions expressed in this commentary are those of the author and may not necessarily reflect those held by Kestra Investment Services, LLC or Kestra Advisory Services, LLC. This is for general information only and is not intended to provide specific investment advice or recommendations for any individual. It is suggested that you consult your financial professional, attorney, or tax advisor with regard to your individual situation.

Securities offered through Kestra Investment Services, LLC (Kestra IS), member FINRA/SIPC. Investment Advisory Services offered through Kestra Advisory Services, LLC (Kestra AS) an affiliate of Kestra IS. CD Wealth Management and Bluespring Wealth Partners LLC* are affiliates of Kestra IS and Kestra AS. Investor Disclosures: https://bit.ly/KF-Disclosures

*Bluespring Wealth Partners, LLC acquires and supports high quality investment adviser and wealth management companies throughout the United States.

Worried About Retirement in a Down Market? Consider These Strategies

The S&P 500 reached a new low last week, closing 25% down from its January peak. Markets may fall even more from here: Since 1961, the average peak-to-trough decline during drawdowns of 25% or more has been 38%. However, historical drawdowns of 25% or more have delivered a forward one-year return of 27% on average, with longer investment time frames proving even more compelling. 

Timing the bottom of this market is difficult, if not impossible, for those considering going to the sideline and waiting to get back in after the market falls further. History suggests that those who stay the course have been rewarded.  

Chart showing S&P 500 market performance during and after drawdowns of 25% or more since 1961
Source: Bloomberg and Goldman Sachs Asset Management. As of October 6, 2022

We read a lot about market returns averaging 8% to 10% per year, but as the chart shows below, such returns are not common at all. The 8% to 10% average comes from many years of outsized returns, followed by weak or negative returns and a few years of average returns. If you are not invested in the market or decide to move to the sidelines, it becomes much harder to obtain average returns. We cannot control the sequence of returns – i.e., what the market does on a yearly basis. It’s no secret that investing is not predictable; the market can be up 10% one year and down 10% the next year.

Chart showing S&P 500 Annual Returns from 2000 to 2002

When you are in the accumulation phase, the sequencing of returns does not have a significant impact on your ending balance. However, when you are entering retirement or taking annual distributions from the portfolio, the sequence of returns can make a big difference. A down market early in retirement — on top of taking distributions from the portfolio — can eat into your wealth through no fault of your own, other than bad timing. 

While we can’t control bear markets, we can control how we respond to them. The key to overcoming sequence-of-return risk is to draw down as little as possible during that down period. Here are some strategies for the newly or nearly retired to consider:

Revisit your need for distributions:

Take another look at how you are planning to fund your expenses and consider alternate strategies to minimize how much you take out. For example:

Healthcare expenses: If you funded an HSA account, make sure you use those funds for qualified health expenses before withdrawing from the portfolio.

Charitable giving: Consider making a large gift to a donor-advised fund during an up year in the market. That fund will become your charitable checkbook so that you do not have to tap into the portfolio during down years in the market.

Flexible withdrawals: Consider taking out more during up markets and pulling back when the market is struggling. This could help you ride out the down market by withdrawing as little as possible.

Build up cash accounts

One way to limit how much you need from retirement accounts is to build up liquidity in your cash accounts. By maintaining short-term cash and cash equivalents — such as CDs, fixed income, and money market accounts — you can keep from having to draw down your retirement funds prematurely. For the first time in many years, money market rates and short term bond rates offer attractive yields, and you can get paid to be in cash with those monies.

Be wary of debt

It makes sense to enter retirement with as little debt as possible. Excessive debt in retirement can affect not only your financial health, but also your physical and mental health as well, due to the strain of paying off debt without income from work.

Know your retirement account options

Once you reach a certain age (72) or older and have a traditional IRA or 401K, the IRS requires you to take an annual required minimum distribution (RMD). Roth IRAs do not have RMDs, allowing you to withdraw funds without penalty or tax. It may make sense before retirement to convert some or all of a traditional IRA to a Roth IRA. This does require that you pay tax on the conversion amount at the time of the conversion. During a down market, doing a Roth conversion can reduce the taxes that you will pay since the value of the IRA is down, and it allows a future market recovery to happen in a tax-free account. 

We fully recognize that bear markets are painful and challenging for all investors. Planning for retirement is a long road trip. On most long road trips, you are bound to run into some trouble — unexpected pit stops, flat tires or even a cracked windshield. But these bumps don’t last for the whole trip, and they do not ruin the overall journey. It is more important than ever to keep perspective and realize that these down markets don’t last forever, and good times have historically lasted much longer than the bad.

The CD Wealth Formula

We help our clients reach and maintain financial stability by following a specific plan, catered to each client. 

Our focus remains on long-term investing with a strategic allocation while maintaining a tactical approach. Our decisions to make changes are calculated and well thought out, looking at where we see the economy is heading. We are not guessing or market timing. We are anticipating and moving to those areas of strength in the economy — and in the stock market. 

We will continue to focus on the fact that what really matters right now is time in the market, not out of the market. That means staying the course and continuing to invest, even when the markets dip, to take advantage of potential market upturns. We continue to adhere to the tried-and-true disciplines of diversification, periodic rebalancing and looking forward, while not making investment decisions based on where we have been.

It is important to focus on the long-term goal, not on one specific data point or indicator. Long-term fundamentals are what matter. In markets and moments like these, it is essential to stick to the financial plan. Investing is about following a disciplined process over time.

Sources: Goldman Sachs, Kestra Asset Management, Robert Baird, NYU

Promo for article titled Fourth-Quarter Outlook: Midterms, More Volatility and the Fed

This material contains an assessment of the market and economic environment at a specific point in time and is not intended to be a forecast of future events, or a guarantee of future results. Forward-looking statements are subject to certain risks and uncertainties. Actual results, performance, or achievements may differ materially from those expressed or implied. Information is based on data gathered from what we believe are reliable sources.

Using diversification as part of your investment strategy neither assures nor guarantees better performance and cannot protect against loss of principal due to changing market conditions.

Past performance is not a guarantee of future results.

The opinions expressed in this commentary are those of the author and may not necessarily reflect those held by Kestra Investment Services, LLC or Kestra Advisory Services, LLC. This is for general information only and is not intended to provide specific investment advice or recommendations for any individual. It is suggested that you consult your financial professional, attorney, or tax advisor with regard to your individual situation.

Securities offered through Kestra Investment Services, LLC (Kestra IS), member FINRA/SIPC. Investment Advisory Services offered through Kestra Advisory Services, LLC (Kestra AS) an affiliate of Kestra IS. CD Wealth Management and Bluespring Wealth Partners LLC* are affiliates of Kestra IS and Kestra AS.  Investor Disclosures: https://bit.ly/KF-Disclosures

*Bluespring Wealth Partners, LLC acquires and supports high quality investment adviser and wealth management companies throughout the United States.

Fourth-Quarter Outlook: Midterms, More Volatility and the Fed

Time slows down for no one. It is hard to believe we are already in the fourth quarter of 2022.

The third quarter of the year saw financial assets continue their decline, as all asset classes — other than cash — delivered negative returns. The Fed’s third consecutive rate hike of 75 basis points (.75%) put further pressure on stocks and bonds. The summer rally we saw in July and early August was erased during the second half of the quarter as inflation continued to rear its ugly head.

The strong correlation of returns between stocks and bonds remained, as bonds were down almost 5% for the quarter. Credit quality in bonds has remained stable this year. However, slower growth, persistent inflation and higher rates could increase credit risk in the coming months. The S&P 500 and NASDAQ both had their worst months since 2008, and the Dow had its worst month since 2002.

International stocks remain challenged by higher energy costs and the ongoing war in Ukraine. Developed markets were down over 9%, and emerging markets were the worst performing in the third quarter, down over 11%. The United Kingdom took strong action last week to step in and purchase bonds to help their markets with additional liquidity. 

Chart showing returns for the third quarter of 2022 by asset class

As we head into the fourth quarter, the main drivers of the market continue to be inflation, China’s path to reopening from the pandemic and war in Ukraine. At the end of the third quarter, we saw a big bounce in short-term interest rates, with the 2-year Treasury trading close to 4.3%. As rates rise, bond prices fall. We are currently seeing high-quality fixed income valuations sitting near 10-year lows. 

At the same time, S&P 500 forward Price to Earnings (PE) multiples are almost 10% below their long-term averages. These attractive valuations in stocks and bonds historically have led to significant long-term investment opportunities. The chart below shows how the market has responded following a bad month of September — and as we previously wrote, this September was one for the record books. The only instance of a continued slide occurred during the Great Financial Crisis, and we do not believe that this market is similar.

Chart showing October market performance after poor September results

What do we expect for the fourth quarter?

As earnings season starts in a few weeks, most companies are in the process of reducing their earnings forecast based on continued inflationary pressures and higher borrowing costs from rising rates. Only 7% of stocks in the S&P 500 are trading above their 50-day moving average. A month ago, that number was more than 90%. Leading economic indicators continue to show weakness in the global economy, and more economists think a recession may occur in 2023. As we have written many times, the stock market is a leading indicator. By the time the recession arrives, the stock market will be looking ahead and ramping up for the recovery phase. 

Here’s what are we watching:

The Federal Reserve: The Fed has forecasted that the Fed Funds rate may move closer to 4.5% by the end of the year. Short-term rates have risen along with the higher Fed Funds Rate. If the Fed indicates it may ease interest rate hikes, we could see a market rally.

International banks: Over the weekend, rumors of potential liquidity issues at Credit Suisse spread through the markets. Questions about risk management and the firm’s ability to compete against larger Wall Street banks sent the stock plunging. Investors fear another “Lehman Brothers moment,” but since the Great Financial Crisis, we have seen a complete overhaul of the banking system to minimize another Lehman scenario.

Market volatility: Market volatility is always unsettling, but historically it is not unusual. We view volatility as an opportunity to purchase more of what you own when we have larger movements in the market.

Midterm elections: As we recently wrote, the S&P 500 has historically outperformed the market in the 12-month period after the election, with an average return of 16.3%. Since 1962, the S&P 500 has not experienced a negative return either six or 12 months following the election. The stock market has historically preferred when one party is in the White House and the other party controls Congress, even if no major legislation is passed.

Bear markets do not last forever. We are in a bear market for the Dow, S&P 500 and NASDAQ. Going back to 1929, the average bear market lasts 20 months and has an average loss of 41%, as seen in the chart below on the right. However, the average bull market lasts 51 months and has an average return of 161%. The chart on the left shows how long it may take to get back to the all-time market highs seen in January, depending on the average annual return achieved. Staying invested during these times allows you to participate on the upside when the market recovers – which, historically, it always has. 

Equity scenarios: Bull, bear and in between

Source: FactSet, NBER, Robert Shiller, Standard & Poor’s, J.P. Morgan Asset Management. (Left) The current peak of 4797 was observed on January 3, 2022. (Right) *A bear market is defined as a 20% or more decline from the previous market high. The related market return is the peak to trough return over the cycle. Bear and bull returns are price returns. **The bear market beginning in January 2022 is currently ongoing. The “bear return” for this period is from the January 2022 market peak through the current rough. Averages for the bear market return and duration do not include figures from the current cycle. Guide to the Markets — U.S. Data are as of September 30, 2022.

The CD Wealth Formula

We help our clients reach and maintain financial stability by following a specific plan, catered to each client. 

Our focus remains on long-term investing with a strategic allocation while maintaining a tactical approach. Our decisions to make changes are calculated and well thought out, looking at where we see the economy is heading. We are not guessing or market timing. We are anticipating and moving to those areas of strength in the economy — and in the stock market. 

We will continue to focus on the fact that what really matters right now is time in the market, not out of the market. That means staying the course and continuing to invest, even when the markets dip, to take advantage of potential market upturns. We continue to adhere to the tried-and-true disciplines of diversification, periodic rebalancing and looking forward, while not making investment decisions based on where we have been.

It is important to focus on the long-term goal, not on one specific data point or indicator. Long-term fundamentals are what matter. In markets and moments like these, it is essential to stick to the financial plan. Investing is about following a disciplined process over time.

Sources: JP Morgan, Carson Investment Research, CNBC, Schwab

Promo for an article titled Here's How the Fed Hopes to Get Inflation Pressures Under Control

This material contains an assessment of the market and economic environment at a specific point in time and is not intended to be a forecast of future events, or a guarantee of future results. Forward-looking statements are subject to certain risks and uncertainties. Actual results, performance, or achievements may differ materially from those expressed or implied. Information is based on data gathered from what we believe are reliable sources.

Using diversification as part of your investment strategy neither assures nor guarantees better performance and cannot protect against loss of principal due to changing market conditions.

Past performance is not a guarantee of future results.

The opinions expressed in this commentary are those of the author and may not necessarily reflect those held by Kestra Investment Services, LLC or Kestra Advisory Services, LLC. This is for general information only and is not intended to provide specific investment advice or recommendations for any individual. It is suggested that you consult your financial professional, attorney, or tax advisor with regard to your individual situation.

Securities offered through Kestra Investment Services, LLC (Kestra IS), member FINRA/SIPC. Investment Advisory Services offered through Kestra Advisory Services, LLC (Kestra AS) an affiliate of Kestra IS. CD Wealth Management and Bluespring Wealth Partners LLC* are affiliates of Kestra IS and Kestra AS.  Investor Disclosures: https://bit.ly/KF-Disclosures

*Bluespring Wealth Partners, LLC acquires and supports high quality investment adviser and wealth management companies throughout the United States.

Here’s How the Fed Hopes to Get Inflation Pressures Under Control

Last week, the Federal Reserve raised the Federal Funds Rate by another 75 basis points (.75%) for the third consecutive meeting. The current range is 3.00% to 3.25%. The Fed expects the Federal Funds Rate to reach 4.50%, implying another 125 basis points (1.25%) of tightening through interest rate hikes. Chairman Jerome Powell hinted that the goal of taming inflation is likely to induce a recession: “Reducing inflation will likely require a sustained period of below-trend economic growth. No one knows whether this process will lead to a recession or, if so, how significant the recession will be.”

At the same time, the Bank of England, Sweden’s central bank, Bank of Canada and European Central Bank have all raised rates by a minimum of 50 basis points (.50%) in the last few weeks. The global outlook is driven by the impact of central bank actions, as well as war in the Ukraine and lockdowns in China.

Powell’s comments pushed stocks sharply lower and sent the U.S. dollar to a 20-year high. (See our previous article: What Does a Stronger U.S. Dollar Mean for You?) Last Friday, stocks closed at their lowest levels since the pandemic in 2020. Stocks have struggled since an unexpectedly hot inflation report in August shocked investors who were looking for price relief. On top of the recent inflation report and the Fed raising rates again, September historically has been the worst month in the stock market, dating back to 1897. Since 1944, only two months have averaged negative returns, with September averaging down .56%, as shown in the chart below.

Theories abound as to why this is the case. It is generally believed that investors come back from summer vacation and want to sell holdings to lock in gains for the year, while others speculate that September marks the beginning of the period when mutual fund companies start to pay distributions, which triggers tax-loss selling. October has seen the largest decline in terms of percentage — think of the crash of 1987 — but historically has been a strong month on average, returning almost 1%.

Chart showing that since 1944, only two months have averaged negative returns, with September averaging down .56%,
Source: CFRA BMO

Historically, when stocks have decreased in value, the bond market has been there to offer a “buffer” or help mitigate downside risk. As the chart shows below, in each instance that the S&P 500 has decreased, going back to 1977, bonds have increased. However, that has not been the case this year. Through the end of August, the S&P 500 and the Bloomberg U.S. Aggregate Bond Index are down double digits. Over the last many years, the stock market has been the primary source of returns as money market and bond yields have been close to 0%. These conditions are sometimes called “TINA,” an acronym for “There Is No Alternative.”

We are moving from TINA to TARA — There Are Reasonable Alternatives. With the Fed Funds rate at 3% and the 2-year Treasury bond over 4%, savers can earn more money on their cash alternatives, and investors do not have to reach for excess yield either in the stock market or through lower credit risk in the bond market.

Chart showing that in each instance that the S&P 500 has decreased, going back to 1977, bonds have increased
Sources: Capital Group, Bloomberg Index Services Ltd., Standard & Poor’s. Returns above reflect annual total returns for all years except 2022, which reflects the year-to-date total return for both indexes. As of August 31, 2022.

The Fed has made it abundantly clear that it is willing to sacrifice growth for lower inflation. Growth expectations were revised lower for this year and next. The Fed’s new forecast for 2023 Gross Domestic Product (GDP) is 1.2%, with an unemployment rate of 4.4%. The Fed needs both GDP to decline and the unemployment rate to increase for inflation to return to its 2% target level. This is because if the overall output of the economy is increasing, price increases may follow as demand outpaces supply. If GDP is declining, corporate profits are less, and demand is decreasing — which in turn may lead to price decreases. 

Much of the most recent inflation increase has been attributed to wage growth. If unemployment increases, then the upward pressure on wages may subside, bringing inflationary pressures down. The economy will be better off the sooner the unemployment rate reaches the “natural rate of employment,” which is the rate that is neither too low and inflationary nor too high and recessionary. At the same time, for the economy to turn the corner, demand and growth need to subside to help with inflationary pressure.

Should inflation begin to recede through a soft labor market and slowing GDP, markets may rebound on prospects for an end to the aggressive rate hikes of 2022. We will need to see several months of evidence that services inflation and wage inflation are trending down. It is critical to remain forward-looking and invested. The fourth quarter is historically the strongest quarter of the year. Missing out on the market rebound, when the largest up days typically occur in a bear market, can be detrimental to the long-term plan that has been constructed for both the good and bad times.

The CD Wealth Formula

We help our clients reach and maintain financial stability by following a specific plan, catered to each client. 

Our focus remains on long-term investing with a strategic allocation while maintaining a tactical approach. Our decisions to make changes are calculated and well thought out, looking at where we see the economy is heading. We are not guessing or market timing. We are anticipating and moving to those areas of strength in the economy — and in the stock market. 

We will continue to focus on the fact that what really matters right now is time in the market, not out of the market. That means staying the course and continuing to invest, even when the markets dip, to take advantage of potential market upturns. We continue to adhere to the tried-and-true disciplines of diversification, periodic rebalancing and looking forward, while not making investment decisions based on where we have been.

It is important to focus on the long-term goal, not on one specific data point or indicator. Long-term fundamentals are what matter.  In markets and moments like these, it is essential to stick to the financial plan. Investing is about following a disciplined process over time.

Sources: American Funds, CFRA BMO, Schwab

Promo for article titled Tips for Planning Charitable Donations, on North Texas Giving Day and Beyond

This material contains an assessment of the market and economic environment at a specific point in time and is not intended to be a forecast of future events, or a guarantee of future results. Forward-looking statements are subject to certain risks and uncertainties. Actual results, performance, or achievements may differ materially from those expressed or implied. Information is based on data gathered from what we believe are reliable sources.

Using diversification as part of your investment strategy neither assures nor guarantees better performance and cannot protect against loss of principal due to changing market conditions.

Past performance is not a guarantee of future results.

The opinions expressed in this commentary are those of the author and may not necessarily reflect those held by Kestra Investment Services, LLC or Kestra Advisory Services, LLC. This is for general information only and is not intended to provide specific investment advice or recommendations for any individual. It is suggested that you consult your financial professional, attorney, or tax advisor with regard to your individual situation.

Securities offered through Kestra Investment Services, LLC (Kestra IS), member FINRA/SIPC. Investment Advisory Services offered through Kestra Advisory Services, LLC (Kestra AS) an affiliate of Kestra IS. CD Wealth Management and Bluespring Wealth Partners LLC* are affiliates of Kestra IS and Kestra AS. Investor Disclosures: https://bit.ly/KF-Disclosures

*Bluespring Wealth Partners, LLC acquires and supports high quality investment adviser and wealth management companies throughout the United States.

Is a Roth IRA the Right Choice for You? Here’s What You Should Consider

In the financial planning process, clients often ask us if it makes sense to open a Roth IRA or convert a traditional IRA to a Roth IRA. As a refresher: With a Roth IRA, you contribute after-tax dollars, your money grows tax-free, and you can generally make tax- and penalty-free withdrawals after age 59½. With a traditional IRA, you contribute pre- or after-tax dollars, your money grows tax-deferred, and withdrawals are taxed as current income after age 59½. Roth IRAs are best suited for individuals in a lower tax bracket who expect to be in a higher tax bracket when they start taking withdrawals later in life. A traditional IRA may be best suited for those who expect to be in the same or lower tax bracket when they start taking withdrawals in retirement.

There are three main distinctions between a traditional IRA and a Roth IRA: eligibility, tax treatment and withdrawal requirements. The chart below provides a good summary on the differences. 

• Eligibility – With both types of IRAs, the owner must have earned income to be eligible to contribute. For a Roth IRA, you must remain under a total income threshold to be eligible to contribute (income limits can be found here). There are no such limits with a traditional IRA; anyone at any income level can contribute.

• Tax treatments – Contributions to a Roth IRA won’t provide any immediate tax benefit because they are not deductible. Contributions to a traditional IRA may be deductible if you are not a participant in an employee-sponsored plan. Withdrawals from a Roth IRA can be tax-free if requirements are met. Withdrawals from a traditional IRA are typically fully taxable as ordinary income.

• Withdrawal requirements – Both traditional and Roth IRAs allow for withdrawals of any amount once you reach age 59½. Once the owner reaches age 72, traditional IRAs are subject to the required minimum distribution (RMD) rules, forcing money out of the IRA and triggering ordinary income. There are no RMD rules related to Roth IRAs; owners can leave the money in the Roth IRA to grow tax-free as long as they want. A Roth IRA’s beneficiaries generally will need to take RMDs to avoid penalties, although there is an exception for spouses.

Chart showing the differences between traditional and Roth IRAs

For those who are not eligible to contribute to a Roth IRA, there still is a way to take advantage of the tax-free growth. The Roth conversion, also known as a “back door Roth IRA,” allows a taxpayer to withdraw funds from a traditional IRA in a taxable distribution and then roll those monies into a Roth IRA. There are no income thresholds for a Roth conversion. If your tax bracket in retirement may be higher than your current tax rate, it may make sense to convert to a Roth IRA from a traditional IRA. This could happen if you accumulate significant savings in your retirement accounts or achieve top earnings later in your career. Here are five potential reasons to convert to a Roth IRA: 

1. Portfolio losses: By converting a traditional IRA to a Roth IRA, the tax will be assessed on the value on the date of the conversion. If you convert to a Roth IRA while the value is lower, the amount of tax owed will be less, and the rebound in value can grow tax free.

2. Anticipating higher tax brackets: If you expect your tax bracket to be higher in retirement, then you may prefer to pay tax on savings now, while you are in a lower tax bracket, and then access those funds tax-free in retirement.

3. Longer growth horizon: Roth IRAs have no RMD obligations, whereas traditional IRAs have RMD after the age of 72. Money in a Roth IRA can stay invested in the stock market longer, giving additional opportunities for growth.

4. Helping your heirs: If your traditional IRA is passed on to your heirs, they will also owe taxes on their withdrawals — and they must be completely withdrawn after 10 years. The Roth IRA withdrawals will be tax free, so you are effectively gifting tax savings to your heirs.

5. Paying for Medicare: If you are enrolled in Medicare Part B or D and your modified adjusted gross income (MAGI) is above a certain threshold, you pay a surcharge on top of your Medicare premium. Withdrawals from a traditional IRA are included in MAGI, while withdrawals from a Roth IRA are not. 

Keep in mind the two biggest drawbacks to a Roth IRA conversion are that you must pay income taxes on any pre-tax funds you convert in the year you make it, and you cannot change your mind once you convert. It generally makes sense to use taxable assets rather than proceeds from the converted IRA to pay the tax cost of the Roth IRA conversion. This is because — all things being equal — the rate of return is generally higher for a Roth IRA because no taxes are due for any gains inside the Roth IRA. 

Please remember that CD Wealth Management does not offer tax advice, but we work closely with your CPA and attorneys to ensure the right strategy is in place for you and your situation. 

The CD Wealth Formula

We help our clients reach and maintain financial stability by following a specific plan, catered to each client. 

Our focus remains on long-term investing with a strategic allocation while maintaining a tactical approach. Our decisions to make changes are calculated and well thought out, looking at where we see the economy is heading. We are not guessing or market timing. We are anticipating and moving to those areas of strength in the economy — and in the stock market. 

We will continue to focus on the fact that what really matters right now is time in the market, not out of the market. That means staying the course and continuing to invest, even when the markets dip, to take advantage of potential market upturns. We continue to adhere to the tried-and-true disciplines of diversification, periodic rebalancing and looking forward, while not making investment decisions based on where we have been.

It is important to focus on the long-term goal, not on one specific data point or indicator. Long-term fundamentals are what matter. In markets and moments like these, it is essential to stick to the financial plan. Investing is about following a disciplined process over time.

Sources: Fidelity, Schwab

Promo for an article titled The Importance of Compound Interest and Tax Planning on Your Portfolio

This material contains an assessment of the market and economic environment at a specific point in time and is not intended to be a forecast of future events, or a guarantee of future results. Forward-looking statements are subject to certain risks and uncertainties. Actual results, performance, or achievements may differ materially from those expressed or implied. Information is based on data gathered from what we believe are reliable sources.

Using diversification as part of your investment strategy neither assures nor guarantees better performance and cannot protect against loss of principal due to changing market conditions.

Past performance is not a guarantee of future results.

The opinions expressed in this commentary are those of the author and may not necessarily reflect those held by Kestra Investment Services, LLC or Kestra Advisory Services, LLC. This is for general information only and is not intended to provide specific investment advice or recommendations for any individual. It is suggested that you consult your financial professional, attorney, or tax advisor with regard to your individual situation.

Securities offered through Kestra Investment Services, LLC (Kestra IS), member FINRA/SIPC. Investment Advisory Services offered through Kestra Advisory Services, LLC (Kestra AS) an affiliate of Kestra IS. CD Wealth Management and Bluespring Wealth Partners LLC* are affiliates of Kestra IS and Kestra AS.  Investor Disclosures: https://bit.ly/KF-Disclosures

*Bluespring Wealth Partners, LLC acquires and supports high quality investment adviser and wealth management companies throughout the United States.

The Importance of Compound Interest and Tax Planning on Your Portfolio

Benjamin Franklin famously once said that “Money makes money. And the money that money makes, makes more money.” He was referring to compound interest. When interest you earn on a balance in a savings or investment account is reinvested, you earn even more money. You aren’t just earning interest on your principal balance; you are earning interest on your interest as well.

For example, if you make a one-time investment of $10,000, then earn 9% per year, the chart below shows the power of compounding your money. After 10 years. the initial $10,000 investment would be worth more than $24,000 — and after 30 years, it would be worth more than $133,000.

Chart showing returns on compound interest versus simple interest over time
Source: Investor.gov, as of November 4, 2021. This hypothetical example assumes the following: (1) starting investment of $10,000; (2) no additional pre-tax contributions; (3) an annual rate of return of 9%; (4) the ending values do not reflect taxes, fees or inflation. If they did, amounts would be lower. Earnings and pre-tax contributions are subject to taxes when withdrawn. Distributions before age 59 1/2 may also be subject to a 10% penalty. Contribution amounts are subject to IRS and Plan limits. Systematic investing does not ensure a profit or guarantee against a loss in a declining market. This example is for illustrative purposes only and does not represent the performance of any security. Consider your current and anticipated investment horizon when making an investment decision, as the illustration may not reflect this. The assumed rate of return used in this example is not guaranteed. Investments that have potential for 9% annual rate of return also come with risk of loss

There is a shortcut to help you estimate the value of a future investment, called the Rule of 72. It’s a quick way to estimate approximately the number of years it will take to double your money using compound interest. As seen in the chart below, if you earn a 6% compounded return per year on your investment, then in about 12 years your money would be worth double. If you annualize 12% a year for 48 years, $10,000 could turn into over $2,500,000! To use the Rule of 72, simply divide 72 by the expected annual rate of return and that will provide you the number of years it would take to double your investment.

Chart explaining the Rule of 72 as it regards compound interest

Simple interest is interest that is earned based solely on the principal amount and is not reinvested. For example, if you have $1,000 and earn a 5% annual interest rate, you will get $50 a year in simple interest. In the second year, you would earn another $50. To calculate how long it would take to double your money with simple interest, the formula would be 1 divided by the rate of return. For example, if you made the same investment of $1,000 earning 5% simple interest, it would take you 20 years to double your money. Note that if you were able to reinvest the money and have it compounding, then it would take approximately 14.4 years to double.

It is important to consider tax implications prior to making any investment. If an investment is going to pay 10% interest on your principal and is in a taxable account, your actual return may be only 6% if you are in a top tax bracket and the income is taxed as ordinary income. If you are not able to reinvest the income, then the income becomes simple interest, and your money can take even longer to double. Suddenly, the 10% investment return that sounded great may not be nearly as good.

Taxes can dramatically impact your investment portfolio, both in the short and long term. There are different types of taxes on investments, and each one is taxed differently:

• Capital gains are profits from the sale of an asset. If you own the asset for more than one year and you sell for a gain, then you will pay long-term capital gains tax. The rate depends on your income level and can either be 0%, 10% or 20%. If you own the asset less than a year and sell it for a gain, then the gain will be taxed as ordinary income.

• Dividends usually are taxable income in the year that they are received. Even if you reinvest the dividend income, you pay tax on that income that year. There are two types of dividend income – qualified and non-qualified. Non-qualified dividends are taxed as ordinary income. Qualified dividends are taxed at either 0%, 15% or 20%, based on income level. 

• Investments in 401Ks or IRAs allow you to defer taxes while the money is inside the account. Taxes are paid when you make a withdrawal, and that money is then considered ordinary income and is taxed at your income level.

Portfolio design and allocation are very important in order to minimize the tax impact on your returns. Structuring the portfolio to have the least tax-efficient assets in retirement accounts helps ensure that those assets are being taxed at ordinary income levels. The chart below shows the difference that tax management can have in a portfolio over time. If your portfolio is managed inefficiently — if it is heavily traded and focused on short-term gains — a $1 million portfolio could miss out on as much as $500,000 of returns over a 10-year period. Compound interest is an extremely powerful tool — whether it is in a retirement account, such as a 401K or IRA, or a taxable account, earning qualified dividends that are reinvested. 

Chart showing the impact of taxes on investments over 10 years


The CD Wealth Formula

We help our clients reach and maintain financial stability by following a specific plan, catered to each client. 

Our focus remains on long-term investing with a strategic allocation while maintaining a tactical approach. Our decisions to make changes are calculated and well thought out, looking at where we see the economy is heading. We are not guessing or market timing. We are anticipating and moving to those areas of strength in the economy — and in the stock market. 

We will continue to focus on the fact that what really matters right now is time in the market, not out of the market. That means staying the course and continuing to invest, even when the markets dip, to take advantage of potential market upturns. We continue to adhere to the tried-and-true disciplines of diversification, periodic rebalancing and looking forward, while not making investment decisions based on where we have been.

It is important to focus on the long-term goal, not on one specific data point or indicator. Long-term fundamentals are what matter. In markets and moments like these, it is essential to stick to the financial plan. Investing is about following a disciplined process over time.

Sources: Fidelity, Forbes, Investopedia, Russell Investments

Promo for an article titled Student Debt, Loan Forgiveness and the Crazy Cost of College

This material contains an assessment of the market and economic environment at a specific point in time and is not intended to be a forecast of future events, or a guarantee of future results. Forward-looking statements are subject to certain risks and uncertainties. Actual results, performance, or achievements may differ materially from those expressed or implied. Information is based on data gathered from what we believe are reliable sources.

Using diversification as part of your investment strategy neither assures nor guarantees better performance and cannot protect against loss of principal due to changing market conditions.

Past performance is not a guarantee of future results.

The opinions expressed in this commentary are those of the author and may not necessarily reflect those held by Kestra Investment Services, LLC or Kestra Advisory Services, LLC. This is for general information only and is not intended to provide specific investment advice or recommendations for any individual. It is suggested that you consult your financial professional, attorney, or tax advisor with regard to your individual situation.

Securities offered through Kestra Investment Services, LLC (Kestra IS), member FINRA/SIPC. Investment Advisory Services offered through Kestra Advisory Services, LLC (Kestra AS) an affiliate of Kestra IS. CD Wealth Management and Bluespring Wealth Partners LLC* are affiliates of Kestra IS and Kestra AS.  Investor Disclosures: https://bit.ly/KF-Disclosures

*Bluespring Wealth Partners, LLC acquires and supports high quality investment adviser and wealth management companies throughout the United States.

Student Debt, Loan Forgiveness and the Crazy Cost of College

Those of us with kids or grandkids are well aware of the crazy cost of college today. Between 1980 and 2020, the average price of tuition, fees and room and board for an undergraduate degree increased 169%. In 1980, the price to attend a four-year college full time was roughly $10,000, adjusted for inflation. By 2020, the total price had increased to roughly $29,000!

Why have the costs of college gone up over time? There are many reasons: growing demand, pressure to go to college, rising financial aid, lower state funding, cost of administration and increasing student amenity packages to keep up. Aside from tuition payments, public colleges depend on funding from state and local governments. Typically, state and local funding make up about 44% of public four-year college revenues. However, economic downturns like we saw in 2008 and 2020 can lead to funding cuts. To make up for the lost dollars, universities must turn to other sources to raise monies, with the most direct source being higher tuition.

For most people, the cost of college may not be manageable – let alone the cost of graduate school or medical school.

More than half of bachelor’s degree recipients from public or private four-year colleges graduated with debt in 2020, with the average debt load being $28,400.

For college graduates with $50,000 or more of debt, the idea of one day owning a home and being debt-free feels like it’s a world away.

Even before President Biden was elected, one of his objectives was to provide student debt relief. Last week, he announced that the government will provide $20,000 in debt relief to Pell grant recipients and $10,000 for many other borrowers. Roughly 43 million Americans hold federal student loan debt, estimated at $1.75 trillion.

Chart showing the growth of student debt for college tuition from 2006 to 2022

Borrowers eligible for loan forgiveness must make less than $125,000 per year individually or $250,000 if married for the 2020 or 2021 tax year. Private loans will not be forgiven as part of the debt relief act. At the same time, the president also announced an extension of the pandemic pause on student loan payments through the end of the year, with payments resuming in January 2023. The Education Department said nearly 8 million borrowers are likely to have their loans forgiven automatically, and the remaining borrowers will have to apply for loan forgiveness. Current students also are eligible for loan cancellation, provided their loans were obtained before July 1, 2022.

There also is a new income-based repayment plan. For undergraduate loans, the relief act caps monthly payments at 5% of a borrower’s discretionary income; currently, borrowers must pay 10%. For borrowers with original loan balances of $12,000 or less, the balance will be forgiven after 10 years of payments; currently, they have to repay their loans for 20 years.

The plan will provide relief for borrowers at a time when the cost of education continues to surge. Critics question the fairness of the plan and warn about the potential impact on inflation should students with forgiven loans increase their spending. The debt forgiveness plan will not be like the $1,200 relief checks that the government sent out during the global pandemic, however they will be relieved of making loan payments over many years. Critics also believe that this relief bill penalizes those who scrimped and saved for college and worked jobs while in college to pay off their loans.

The elephant in the room remains the exorbitant cost of college, and many fear that government debt relief might encourage future students to take on even more debt, allowing colleges and universities to raise prices even further.

Chart showing the highlight's of Joe Biden's student loan debt plan for college costs, including tuition

Regardless of political beliefs, the affordability of higher education remains a larger issue. Between 2000 and 2021, the cost of college tuition increased at more than twice the pace of overall inflation, despite a slowdown in tuition hikes during the pandemic. As is most often the case with many bills passing Congress, only time will tell the full economic impact of the Student Relief Act. 

While the form for forgiveness is not available yet, federal student loan borrower updates can be received by subscribing via the Department of Education’s website here.   

The CD Wealth Formula

We help our clients reach and maintain financial stability by following a specific plan, catered to each client. 

Our focus remains on long-term investing with a strategic allocation while maintaining a tactical approach. Our decisions to make changes are calculated and well thought out, looking at where we see the economy is heading. We are not guessing or market timing. We are anticipating and moving to those areas of strength in the economy — and in the stock market. 

We will continue to focus on the fact that what really matters right now is time in the market, not out of the market. That means staying the course and continuing to invest, even when the markets dip, to take advantage of potential market upturns. We continue to adhere to the tried-and-true disciplines of diversification, periodic rebalancing and looking forward, while not making investment decisions based on where we have been.

It is important to focus on the long-term goal, not on one specific data point or indicator. Long-term fundamentals are what matter. In markets and moments like these, it is essential to stick to the financial plan. Investing is about following a disciplined process over time.

Sources: Forbes, CNBC, Newsweek, USA Today

Promo for an article titled Are Alternative Investments Too Good to Be True? Here's What You Should Know

This material contains an assessment of the market and economic environment at a specific point in time and is not intended to be a forecast of future events, or a guarantee of future results. Forward-looking statements are subject to certain risks and uncertainties. Actual results, performance, or achievements may differ materially from those expressed or implied. Information is based on data gathered from what we believe are reliable sources.

Using diversification as part of your investment strategy neither assures nor guarantees better performance and cannot protect against loss of principal due to changing market conditions.

Past performance is not a guarantee of future results.

The opinions expressed in this commentary are those of the author and may not necessarily reflect those held by Kestra Investment Services, LLC or Kestra Advisory Services, LLC. This is for general information only and is not intended to provide specific investment advice or recommendations for any individual. It is suggested that you consult your financial professional, attorney, or tax advisor with regard to your individual situation.

Securities offered through Kestra Investment Services, LLC (Kestra IS), member FINRA/SIPC. Investment Advisory Services offered through Kestra Advisory Services, LLC (Kestra AS) an affiliate of Kestra IS. CD Wealth Management and Bluespring Wealth Partners LLC* are affiliates of Kestra IS and Kestra AS.  Investor Disclosures: https://bit.ly/KF-Disclosures

*Bluespring Wealth Partners, LLC acquires and supports high quality investment adviser and wealth management companies throughout the United States.

Are Alternative Investments Too Good to Be True? Here’s What You Should Know

We have all been there before. You’re at a social event or party where you hear of a great opportunity to invest in some “private” deal or alternative investment. Maybe it is someone starting a business or an inventor with the next great idea — or even a new technology that may change the world. Some people may think these opportunities are like being invited to join an exclusive club for the rich and famous. Others may be searching for different ways to invest money outside of the liquid, public markets. 

Historically, these types of investments have been more accessible for the super-wealthy and made popular by Harvard or Yale endowments. They tend not to be correlated with the stock market and may offer the potential for high returns, but typically with much higher risk.

Opportunities such as these are called private investments or alternative investments — financial assets or investments outside the stock and bond market. Examples include private equity, hedge funds, venture capital, real estate, commodities and cryptocurrencies. Here’s a brief description of several alternative investments:

Private equity funds are invested directly into companies rather than into publicly traded stocks or bonds. Private equity firms raise money from investors and institutions and invest those monies directly into non-traded companies. There are several different types of private equity investments, such as distressed funds, leveraged buyouts and “fund of funds,” for example. 

Hedge funds are investment structures that pool monies together to invest in many different asset classes, and they are typically unconcerned with market direction. In its simplest form, a hedge fund is known as Long-Short. They go “long” by buying one stock in an industry, such as Ford, and “short” by selling another stock in the same industry, such as GM. Therefore, they are what is called market neutral.  Hedge funds, like private equity, take on many different types, such as macro, equity, value and distressed.

Venture capital investment typically involves financing startup companies and businesses. This is similar to how private equity works, but venture capital invests more in startup and early-stage businesses, whereas private equity investments are usually in more developed companies. There are different forms of venture capital investments such as seed, early-stage and expansion investments.

Real estate investments such as investment properties, office buildings, apartments or vacation homes also are considered alternative investments, as they are purchased outside of the publicly traded markets. There are many other types of alternative investments within real estate such as hard money loans, private notes, real estate partnerships and opportunity zone investments.  

Commodities are investments that typically are available to investors of all experience levels and easier to purchase than other alternatives, such as gold, silver, oil or natural gas.

Cryptocurrency has become a more recent phenomenon among alternative investments. Investors are putting money into Bitcoin or Ethereum or in the network blockchain, which is a digital ledger to track cryptocurrency movement and ownership. 

Graphic illustrating different investment types

The pros and cons of alternative investments

PROS:

They are not correlated to the stock market. This means that they add diversification to your portfolio while attempting to minimize risk. As we briefly outlined above, there are many different types of alternative investments, and the more investments one owns, the more one can potentially further reduce volatility in the portfolio.

There is a potential for increased returns. As with any risky investment, there are no guarantees or guaranteed returns. Proponents of alternative investments maintain that higher returns can be achieved through these types of investments — but with the potential for higher returns comes higher risk.

CONS:

They lack liquidity. Alternative investments tend to be private, i.e., not publicly traded, and therefore, they are less liquid. This means that they may be difficult to exit, and your monies could be tied up for many years, giving you no access to those funds. During the Great Recession, for example, many alternative investments stopped any redemptions of their funds, and clients who needed the money had no access to those monies.

They have high investment minimums. For many people, higher minimums may make such investments unavailable. If an investment requires a high minimum to participate and that investment makes up a large percentage of your net worth, then it may not be prudent to have that much of your nest egg in one, potentially illiquid investment.

They have higher fees. Most alternative investments carry higher investment fees than publicly traded funds do. At the same time, alternative investment fees are not always transparent, nor are they regulated by the SEC. Fees vary based on the type of investment, so it is important to understand the fee structure and how the fund manager gets paid.

They lack regulation. Alternative investments are not regulated by the SEC and are not subject to reporting requirements. In addition, the underlying assets are often difficult to value, which can be deceptive for pricing and price transparency. Because of the lack of regulation and transparency, this can lead to risk of fraudulent investments. When you buy a stock, index fund, mutual fund or bond, you know that what you are buying is a real asset.

They are complex. Alternative investments are often complex instruments and may require a high level of due diligence. If you are considering an alternative investment, it is imperative to do the research and understand all tax implications as well. For example, you may be a limited partner requiring a K-1, which in turn may delay filing your taxes. If you have several private investments, you may receive several K-1s, and this could lead to increased fees for filing taxes.

In recent years, alternative investments have grown in popularity. During down markets, alternative investments seem to become more popular as investors look to invest in something other than stocks.

Since alternative investments don’t have the same liquidity, transparency and valuation requirements of publicly traded stocks and bonds, investors may think that alternatives offer more security. 

As seen in the pyramid below, alternative investments are higher on the risk scale, and therefore need to be well thought out and researched before investing capital. Please remember: If it sounds too good to be true, it normally is!

Pyramid chart ranking investment types according to risk

The CD Wealth Formula

We help our clients reach and maintain financial stability by following a specific plan, catered to each client. 

Our focus remains on long-term investing with a strategic allocation while maintaining a tactical approach. Our decisions to make changes are calculated and well thought out, looking at where we see the economy is heading. We are not guessing or market timing. We are anticipating and moving to those areas of strength in the economy — and in the stock market. 

We will continue to focus on the fact that what really matters right now is time in the market, not out of the market. That means staying the course and continuing to invest, even when the markets dip, to take advantage of potential market upturns. We continue to adhere to the tried-and-true disciplines of diversification, periodic rebalancing and looking forward, while not making investment decisions based on where we have been.

It is important to focus on the long-term goal, not on one specific data point or indicator. Long-term fundamentals are what matter. In markets and moments like these, it is essential to stick to the financial plan. Investing is about following a disciplined process over time.

Sources: Forbes, Investopedia

Promo for article titled Unpacking the Inflation Reduction Act: How Will it Affect You?

This material contains an assessment of the market and economic environment at a specific point in time and is not intended to be a forecast of future events, or a guarantee of future results. Forward-looking statements are subject to certain risks and uncertainties. Actual results, performance, or achievements may differ materially from those expressed or implied. Information is based on data gathered from what we believe are reliable sources.

Using diversification as part of your investment strategy neither assures nor guarantees better performance and cannot protect against loss of principal due to changing market conditions.

Past performance is not a guarantee of future results.

The opinions expressed in this commentary are those of the author and may not necessarily reflect those held by Kestra Investment Services, LLC or Kestra Advisory Services, LLC. This is for general information only and is not intended to provide specific investment advice or recommendations for any individual. It is suggested that you consult your financial professional, attorney, or tax advisor with regard to your individual situation.

Securities offered through Kestra Investment Services, LLC (Kestra IS), member FINRA/SIPC. Investment Advisory Services offered through Kestra Advisory Services, LLC (Kestra AS) an affiliate of Kestra IS. CD Wealth Management and Bluespring Wealth Partners LLC* are affiliates of Kestra IS and Kestra AS. Investor Disclosures: https://bit.ly/KF-Disclosures

*Bluespring Wealth Partners, LLC acquires and supports high quality investment adviser and wealth management companies throughout the United States.

Unpacking the Inflation Reduction Act: How Will It Affect You?

The Build Back Better Act that was so widely discussed at the beginning of the year has come to fruition in the form of the Inflation Reduction Act of 2022, which President Biden signed into law Tuesday. Its objective is to reduce inflation and the deficit, lower drug costs and increase investment in domestic energy production. The outcome of the Inflation Reduction Act will not be known for years to come, of course, but we want to discuss how some important parts of it may affect you.

What’s in the Inflation Reduction Act?

1. The bill introduces a 15% minimum corporate tax that applies to companies generating more than $1 billion in annual profit (based on a three-year average). Congress’ Joint Committee on Taxation estimates that fewer than 150 companies will be subject to the new rate. At the same time, there is a new 1% tax on stock buybacks. A stock buyback, or share repurchase, occurs when a company buys outstanding shares of its own stock to reduce the number of shares available on the open market. One reason companies may do this is to increase the value of the remaining shares available. It is an investment a company makes in itself when it believes its shares are trading too cheaply in the open market. The new 1% tax goes into effect in 2023, which could cause some companies to speed up buying shares this year and “tilt future capital deployment toward dividends,” Wells Fargo says.  

2. The act has the potential to save retirees a significant sum of money on healthcare costs. It allows Medicare to negotiate prices for certain drugs for the first time in 2026 — starting with 10 drugs, then expanding the list to 15 drugs in 2027 and 20 in 2029. The act caps out-of-pocket drug costs at $2,000 a year for Medicare beneficiaries, starting in 2025. Today, there is no cap on what people may spend. The act also caps insulin costs at $35 per month for those on Medicare. Additionally, all vaccines will be covered under Medicare part D. According to a recent study by the Center for Retirement Research, retirees spend about 25% of their Social Security on medical expenses, including Medicare premiums and out-of-pocket costs for prescription drugs.  

3. The Inflation Reduction Act allocates $80 billion over 10 years to increase IRS enforcement on taxpayers with more than $400,000 in income, with the goal to catch more tax cheaters. It is widely believed that this will dramatically increase the need for labor in our country, but with the unemployment rate at 3.5%, the question is: Where will the IRS find the new auditors needed?

Expected Results from the Inflation Reduction Act

REVENUE
15% corporate minimum tax: $313 billion*
Prescription drug pricing reform: $288 billion**
Enhanced IRS tax enforcement: $124 billion**
Total revenue raised: $725 billion

INVESTMENTS
Energy security & climate change investment: $369 billion***
Affordable Care Act extension: $64 billion**
Total investments: $433 billion

TOTAL DEFICIT REDUCTION: $292+ billion

* Joint Committee on Taxation, ** Congressional Budget Office, *** Both

4. The largest investment made by the Act relates to energy security and climate change, with billions of dollars going to expand wind and solar power production. Additional subsidies will be available for purchases of electric vehicles as well as funding for people to install energy-efficient heating and cooling systems in their homes. However, new rules make the EV tax credit harder to get, as there are limits as to the percentage of production that must occur in North America for the cars as well as for batteries. The credit is unavailable if the taxpayer’s adjusted gross income exceeds a threshold amount ($300,000 for taxpayers filing a joint return, $150,000 for single filers). There also is money available to oil companies to reduce greenhouse gas emissions and penalties for those that fail to do so.  

No one can predict the long-term results of the Inflation Reduction Act of 2022. The good news is that inflation appears to be easing on its own as global supply chain disruptions ease and the Federal Reserve’s tightening of money supply is working. There is little debate, though, that this bill will help reduce the deficit. Retirees stand to benefit heavily from the future reduction in drug costs. The legislation stands to create the single largest investment in climate and energy in the U.S. to date: roughly $369 billion, with estimates of cutting emissions by as much as 40% by 2030. At the end of the day, though, we won’t know for many years how the Inflation Reduction Act affects inflation or corporate profitability.

The CD Wealth Formula

We help our clients reach and maintain financial stability by following a specific plan, catered to each client. 

Our focus remains on long-term investing with a strategic allocation while maintaining a tactical approach. Our decisions to make changes are calculated and well thought out, looking at where we see the economy is heading. We are not guessing or market timing. We are anticipating and moving to those areas of strength in the economy — and in the stock market. 

We will continue to focus on the fact that what really matters right now is time in the market, not out of the market. That means staying the course and continuing to invest, even when the markets dip, to take advantage of potential market upturns. We continue to adhere to the tried-and-true disciplines of diversification, periodic rebalancing and looking forward, while not making investment decisions based on where we have been.

It is important to focus on the long-term goal, not on one specific data point or indicator. Long-term fundamentals are what matter. In markets and moments like these, it is essential to stick to the financial plan. Investing is about following a disciplined process over time.

Sources: CNBC, Investopedia, Financial Planning Magazine, Kestra Investment Management

Promo for an article titled Valuable Financial Advice for the Recent College Graduates in Your Life

This material contains an assessment of the market and economic environment at a specific point in time and is not intended to be a forecast of future events, or a guarantee of future results. Forward-looking statements are subject to certain risks and uncertainties. Actual results, performance, or achievements may differ materially from those expressed or implied. Information is based on data gathered from what we believe are reliable sources.

Using diversification as part of your investment strategy neither assures nor guarantees better performance and cannot protect against loss of principal due to changing market conditions.

Past performance is not a guarantee of future results.

The opinions expressed in this commentary are those of the author and may not necessarily reflect those held by Kestra Investment Services, LLC or Kestra Advisory Services, LLC. This is for general information only and is not intended to provide specific investment advice or recommendations for any individual. It is suggested that you consult your financial professional, attorney, or tax advisor with regard to your individual situation.

Securities offered through Kestra Investment Services, LLC (Kestra IS), member FINRA/SIPC. Investment Advisory Services offered through Kestra Advisory Services, LLC (Kestra AS) an affiliate of Kestra IS. CD Wealth Management and Bluespring Wealth Partners LLC* are affiliates of Kestra IS and Kestra AS.  Investor Disclosures: https://bit.ly/KF-Disclosures

*Bluespring Wealth Partners, LLC acquires and supports high quality investment adviser and wealth management companies throughout the United States.

Are We in a Recession? Here Are the Indicators You Should Be Watching

Reports last week indicated that gross domestic product (GDP) contracted by -0.9% for the second quarter of the year, the second consecutive quarter of negative GDP growth after the first-quarter decline of -1.6%. As a reminder, GDP is the monetary value of all finished goods and services produced within a country’s borders during a specific time period, adjusted for inflation. 

Many investors and economists accept that a recession is traditionally defined as two consecutive quarters of GDP decline. However, negative GDP growth alone may be insufficient to describe a recession. Typically, we see rising defaults from companies and individuals as well as higher unemployment during a recession. As we have often written before, the National Bureau of Economic Research — a private research organization and the official arbiter of identifying recessions in the U.S. — describes a recession as “a significant decline in economic activity, spread across the economy, lasting more than a few months.” This definition leaves a lot of room for interpretation. 

The following are other observable and measurable economic conditions that could be recession indicators: 

Decline in real GDP: As stated above, we have seen two consecutive quarters of negative GDP growth. Expectations for GDP growth have continued to decrease. Annual GDP growth rates remain positive, but estimates continue to be lowered as the year progresses.  
Decline in real income: Real median household income takes time to calculate due to revisions in inflation data. Data from May shows that personal income increased by .5%, disposable personal income increased by .5% and personal consumption expenditures increased by .2%. However, real disposal personal income decreased by .1%. Why the difference? Inflation. Remember, real income — also known as real wage — is how much money one makes after adjusting for inflation.   
Decline in employment: The unemployment rate has remained steady at 3.6% for five months in a row and arguably represents near full employment for the economy. The low unemployment rate combined with the rise in wages may suggest that consumers are somewhat resilient to a potential recession and economic slowdown.
Decline in industrial production: The industrial production index measures levels of production and capacity in the manufacturing, mining, electric and gas industries. Industrial production for June declined .2%, and prior months also were revised lower. The average monthly gain so far this year, however, remains positive at .4%. Industrial production increased at an annual rate of 6.1% for the second quarter. In a recession, we typically would see strong negative levels in the industrial production index.  
Decline in wholesale/retail sales: The consumer has remained strong and resilient for the first half of the year. The most recent wholesale report showed an increase of .5% and an increase in 20.9% from the May 2021 level. The most recent retail sales report exceeded expectations and showed an increase of 1% from the previous month and 8.4% above June 2021. 

If a recession were to occur, remember that not all recessions are the same. Recessions generally fall into three categories: 

Asset bubble recession: Think of the recession from the technology bubble in 2000 or the great financial crisis of 2008, caused by the housing crisis. This typically leads to a larger financial crisis and results in steep market declines. 
• Geopolitically driven recession: These are based on events such as the oil embargo of 1973-1974 or the COVID recession of 2020. They are typically the shortest in duration because they are event-driven.  
• Cyclical slowdown recession: This type of recession is usually the least extreme and occurs when there is a shift in supply and demand. As the chart below shows, cyclical slowdown recessions going back to 1947 decline 19.2% on average and have a very strong return the following year.

Average Equity Drawdown and Recovery During Recessions since 1947

Chart showing average equity drawdown and recovery during recessions since 1947
Source: Bloomberg and National Bureau of Economic Research. Published by AssetMark.

While the probability of a recession has increased, recessions in and of themselves are unavoidable. The economic indicators listed above will continue to provide us measurable data about the U.S. economy.

In spite of two consecutive quarters of negative GDP growth, the labor market remains strong, consumers seem resilient today, and output shows that supply-chain issues may be resolving themselves, especially with automobiles. Remember, recessions don’t last forever, and neither do bear markets.

Our focus remains on long-term investing with a strategic allocation while maintaining a tactical approach. Our decisions to make changes are calculated and well thought out, looking at where we see the economy is heading. We are not guessing or market timing. We are anticipating and moving to those areas of strength in the economy and the stock market. 

We will continue to focus on the fact that what really matters right now is time in the market, not out of the market. That means staying the course and continuing to invest, even when the markets dip to take advantage of potential market upturns. We continue to adhere to the tried-and-true disciplines of diversification, periodic rebalancing and looking forward, while not making investment decisions based on where we have been.

It is important to focus on the long-term goal, not on one specific data point or indicator. Long-term fundamentals are what matter. In markets and moments like these, it is essential to stick to the financial plan. Investing is about following a disciplined process over time.

Sources: AssetMark, Investopedia, Lord Abbett

Promo for article titled The Portfolio Changes We're Making as the Third Quarter Begins

This material contains an assessment of the market and economic environment at a specific point in time and is not intended to be a forecast of future events, or a guarantee of future results. Forward-looking statements are subject to certain risks and uncertainties. Actual results, performance, or achievements may differ materially from those expressed or implied. Information is based on data gathered from what we believe are reliable sources.

Using diversification as part of your investment strategy neither assures nor guarantees better performance and cannot protect against loss of principal due to changing market conditions.

Past performance is not a guarantee of future results.

The opinions expressed in this commentary are those of the author and may not necessarily reflect those held by Kestra Investment Services, LLC or Kestra Advisory Services, LLC. This is for general information only and is not intended to provide specific investment advice or recommendations for any individual. It is suggested that you consult your financial professional, attorney, or tax advisor with regard to your individual situation.

Securities offered through Kestra Investment Services, LLC (Kestra IS), member FINRA/SIPC. Investment Advisory Services offered through Kestra Advisory Services, LLC (Kestra AS) an affiliate of Kestra IS. CD Wealth Management and Bluespring Wealth Partners LLC* are affiliates of Kestra IS and Kestra AS.  Investor Disclosures: https://bit.ly/KF-Disclosures

*Bluespring Wealth Partners, LLC acquires and supports high quality investment adviser and wealth management companies throughout the United States.