As we approach the end of the year, now is a good time to take a closer look at required minimum distributions (RMDs). Required minimum distributions apply to retirement accounts such as IRAs, SEP plans and Simple IRAs, as well as 401(k)s, 403(b)s, 457(b)s, profit-sharing plans and other defined contribution plans. Money that is invested in retirement accounts is not tax-free; it grows tax-deferred over time, and the government has rules about when it must be taken out.
What are RMDs?
Once you turn 72 years old, you are required to take minimum distributions from your traditional IRAs and most employer-sponsored retirement plans. You can always take more than the minimum amount if you choose. You also can take money out of your retirement account before age 72 (penalty-free after age 59½). However, there is a minimum amount that must be taken each year at age 72, whether you have taken money out before that age or not. Failing to take the full amount of the RMD could result in a penalty tax of 50% on the difference. For example, if your RMD is $5,000, and you fail take that amount out of your plan, you could face a $2,500 penalty!
Generally, RMDs must be taken by Dec. 31 each year. You are allowed to delay the first RMD until April 1 after the year in which you reach RMD age — but in that case, you will need to take two RMDs in one year, with the second coming by Dec. 31. Taking two distributions in one year might bump you into a higher income tax bracket, so this often is not the recommended approach.
How much do I have to withdraw each year?
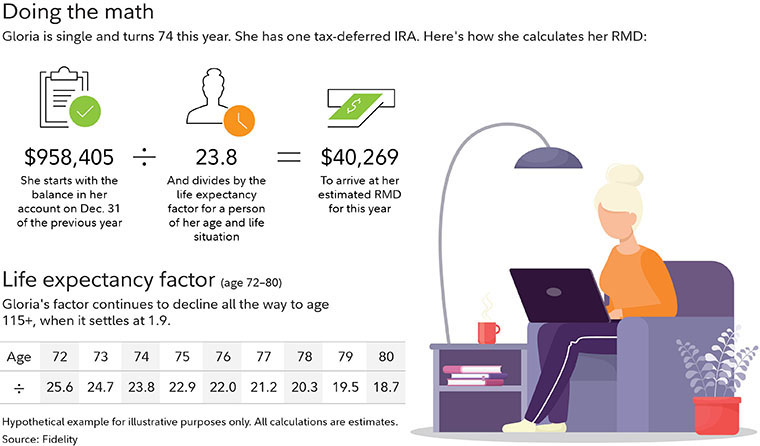
The amount changes each year, according to your age. The first step is to calculate the Dec. 31 balance for your retirement accounts. Next, find your age in the IRS uniform lifetime table and the corresponding distribution period. (The distribution period is an estimate of how many years you will be taking RMDs.) Divide the balance by the distribution period to determine the RMD. In the example below, the ending balance of the retirement accounts is $958,405. At 74 years of age, the distribution period is 23.8. Therefore, the RMD would be $40,269, the minimum amount that must be withdrawn from the accounts for the year. This amount is taxed as ordinary income.
You are allowed to take the entire RMD out of one account, even if you have several retirement accounts, or you can take it from several retirement accounts — as long as you withdraw the required minimum amount in total.
Exceptions to RMDs
There is one exception when it comes to 401(k) RMDs. If you are still working for the company sponsoring your plan by the time you turn the required age and you don’t own 5% or more of that company, you may be able to avoid RMDs. However, not all plans allow this, so you need to double-check with the plan administrator. Once you leave the company, you will need to start taking withdrawals from your 401(k). Please keep in mind that this exception applies to 401(k)s only. If you have an IRA in addition to your 401(k), you will need to take your RMD regardless of whether you are still working or not.
Recent RMD rule changes and complexities
The SECURE Act of 2019 raised the RMD age from 70½ to 72 beginning in 2020. That means if you reached age 70½ before 2020, you are currently taking RMDs. Then came the pandemic, and in 2020, Congress passed the CARES Act. One of the purposes of this act was to help individuals manage financial challenges brought on by the pandemic, and RMDs were waived for 2020 — including any that were postponed in 2019. Please note that RMDs have resumed for 2021 and must be taken this year; the CARES Act applied to 2020 only.
The IRS has issued new life expectancy tables designed to help investors stretch their retirement savings over a longer period. These new tables take effect for RMDs beginning in 2022. What does this mean for you? This will typically lead to lower annual RMD amounts and potentially lower income tax obligations. However, if the portfolio balance of your retirement accounts continues to grow, then the amount you must take as a distribution also may continue to grow.
How to minimize the tax impact of RMDs
An individual donor can contribute up to $100,000 per year in qualified charitable donations (QCDs) if the individual is 70½ or older. In married couples, each spouse can make QCDs up to $100,000 for a potential total of $200,000. QCDs can be made only to certain qualified charitable organizations; they cannot be made to donor-advised funds. If a donor makes a QCD that exceeds the individual’s RMD, the extra distribution cannot be carried over (i.e., used to meet the minimum distribution in following years).
+++
So, what can we learn from all this? An RMD is the smallest amount you must withdraw from your tax-deferred retirement accounts every year after a certain age. If you have multiple retirement accounts, you can withdraw money from each account or from one account, as long as you withdraw the total required minimum. Each dollar withdrawn as part of the RMD is ordinary income. If you have charitable donations and are over the age of 70, using part or all of your RMD can be a great planning tool. (You will need to make sure the funds go directly from the retirement account to the charitable organization.)
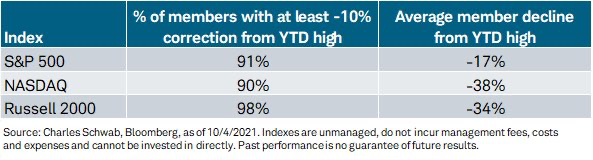
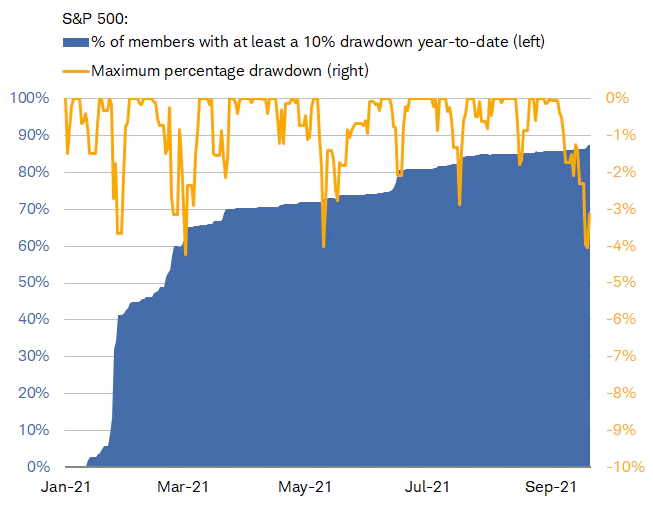
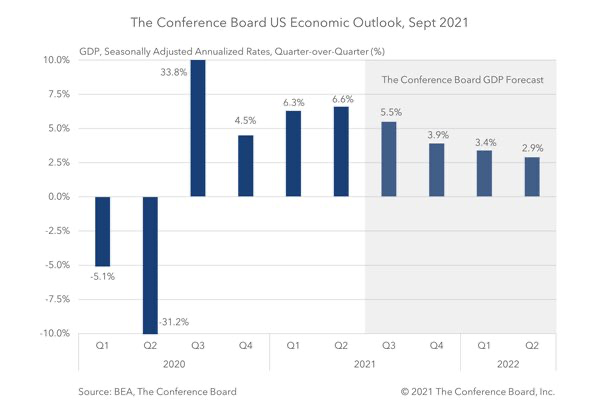
From a portfolio perspective, we continue to adhere to the tried-and-true disciplines of diversification, periodic rebalancing and looking forward, while not making investment decisions based on where we have been. Making market decisions based on what might happen may be detrimental to long-term performance. The key is to stay invested and stick with the financial plan. Markets go up and down over time, and downturns present opportunities to purchase stocks at a lower value. As we say each week, it is important to stay the course and focus on the long-term goal — not on one specific data point or indicator.
It all starts with a solid financial plan for the long run that understands the level of risk that is acceptable for each client. Regarding investments, we believe in diversification and having different asset classes that allow you to stay invested. The best option is to stick with a broadly diversified portfolio that can help you to achieve your own specific financial goals — regardless of market volatility. Long-term fundamentals are what matter.
Sources: Fidelity, AARP, Broadridge

This material contains an assessment of the market and economic environment at a specific point in time and is not intended to be a forecast of future events, or a guarantee of future results. Forward-looking statements are subject to certain risks and uncertainties. Actual results, performance, or achievements may differ materially from those expressed or implied. Information is based on data gathered from what we believe are reliable sources.
Using diversification as part of your investment strategy neither assures nor guarantees better performance and cannot protect against loss of principal due to changing market conditions.
Past performance is not a guarantee of future results.
The opinions expressed in this commentary are those of the author and may not necessarily reflect those held by Kestra Investment Services, LLC or Kestra Advisory Services, LLC. This is for general information only and is not intended to provide specific investment advice or recommendations for any individual. It is suggested that you consult your financial professional, attorney, or tax advisor with regard to your individual situation.
Securities offered through Kestra Investment Services, LLC (Kestra IS), member FINRA/SIPC. Investment Advisory Services offered through Kestra Advisory Services, LLC (Kestra AS) an affiliate of Kestra IS. Kestra IS and Kestra AS are not affiliated with CD Wealth Management. Investor Disclosures: https://bit.ly/KF-Disclosures