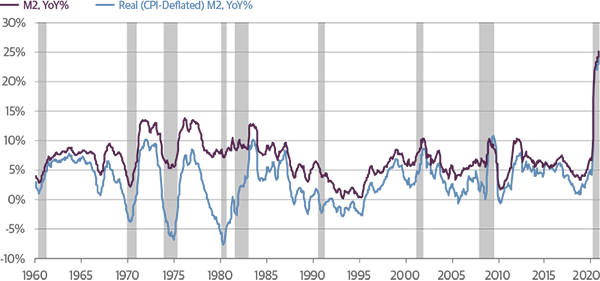
The markets continue to climb, lifted by positive economic data, such as manufacturing, homebuilding and increased employment. As vaccines become more widespread and the public begins to venture out, businesses will continue to reopen, and their capacity will expand. All signs point toward a strong GDP in 2021 as fiscal and monetary stimuli pump an unprecedented amount of liquidity into the economy.
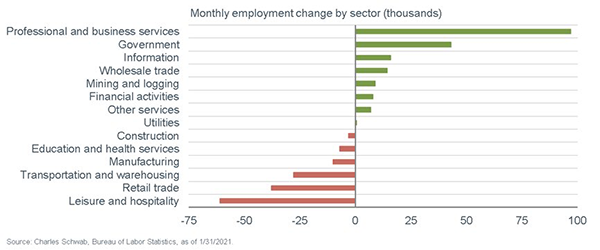
The improving business confidence may translate into strong capital goods shipments as well, and hiring is picking up, as seen by the March job numbers. Restaurants will continue to add capacity, as will the airline and hospitality industries. Positive momentum for the global economy widens the range of outcomes for how strong our GDP may be in 2021.
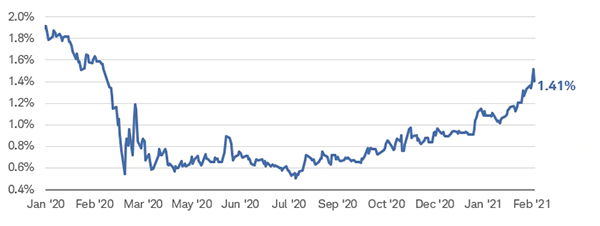
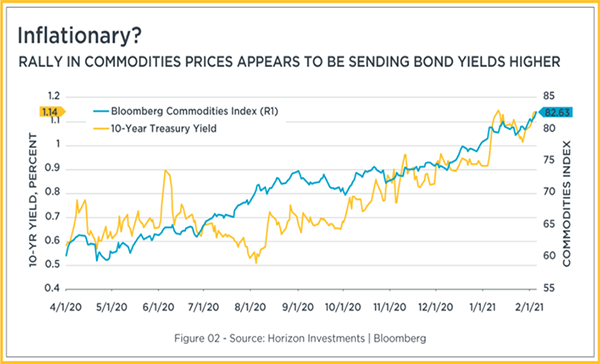
Earnings, interest rates and inflation are three ingredients that will help determine the trajectory of stock prices over the next several years. Earnings expectations continue to remain a bright spot for the stock market. The expectations for 2021 earnings on the S&P 500 are 26% higher than in 2020; these estimates continue to rise, and projections may move even higher. The Fed has made it clear that interest rates will remain low through 2022, even though the 10-year and 30-year Treasury rates may continue to move higher. Stocks have been relatively unfazed with the rise in the 10-year Treasury bond.
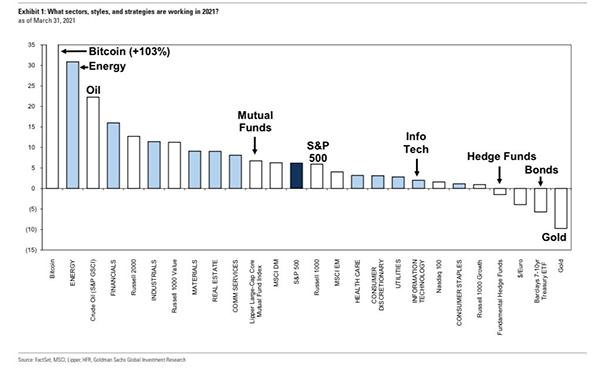
The first quarter in the stock market did see sector rotation taking place, as seen in the chart below. Large-cap growth stocks finished the quarter basically flat, while value stocks outperformed. The sectors that have been leading the last few years, such as information technology and consumer discretionary, lagged in the first quarter, while energy and financials were strong performers. One could argue that these sectors were due for a break after the tremendous run the last two years, but rising rates also were a factor.
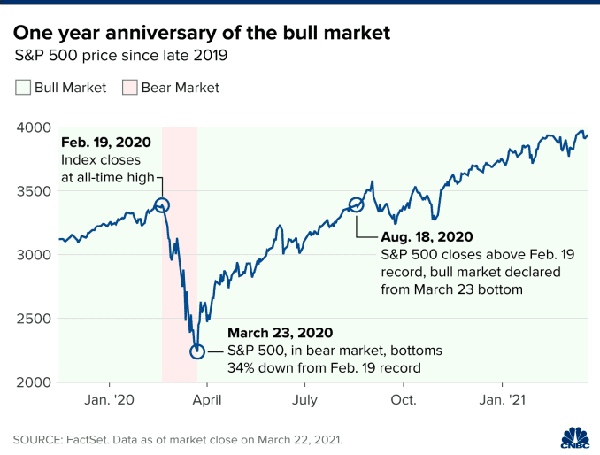
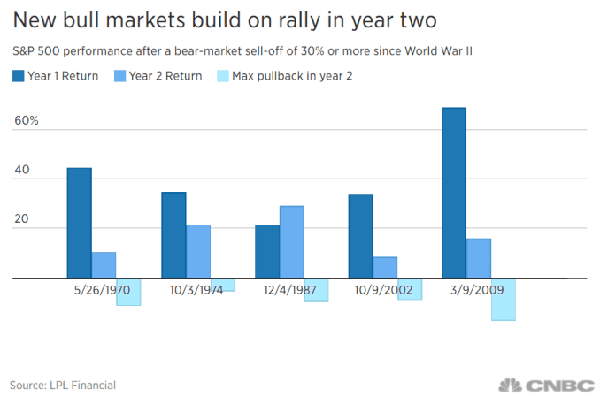
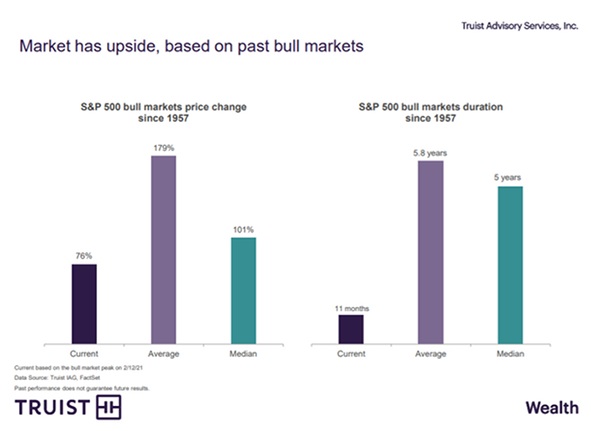
It is natural to be apprehensive about the market, given the current levels. Skepticism and caution can lead to focusing on near-term issues, instead of concentrating on the endgame. Economic expansions since World War II have lasted 26 quarters on average, with the shortest expansion being 11 quarters and the longest 48 quarters. The current cycle is only five quarters old. During expansions, markets may take a breather and have a correction, but keeping an eye on the long term remains the best approach.
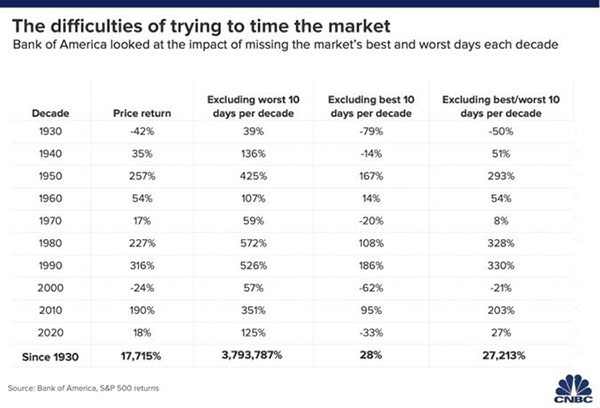
So, what can we learn from all this? Markets go up and down over time. The key is to stay invested and stick with the financial plan. Market downturns present opportunities to purchase stocks that were previously viewed as overvalued. In a down market, you are “buying low,” one of the fundamental tenets of investing.
Given the difficulty of timing the market, the most realistic strategy for a majority of investors is to invest and stay invested over time. Procrastination, or not investing, is worse than bad timing. We continue to view more risk being out of the market than in the market. Riding out future market volatility, in addition to having a diversified portfolio, means staying the course. From an investment perspective, we use trends to help with the strategic and tactical asset allocation and where we see the portfolio heading over the next 5-7 years with short-term adjustments along the way.
It all starts with a solid financial plan for the long run that understands the level of risk that is acceptable for each client. With regards to investments, we believe in diversification and having different asset classes that allow you to stay invested. The best option is to stick with a broadly diversified portfolio that can help you to achieve your own specific financial goals — regardless of market volatility. Long-term fundamentals are what matter.
Sources: Factset, Smith Asset Management

This material contains an assessment of the market and economic environment at a specific point in time and is not intended to be a forecast of future events, or a guarantee of future results. Forward-looking statements are subject to certain risks and uncertainties. Actual results, performance, or achievements may differ materially from those expressed or implied. Information is based on data gathered from what we believe are reliable sources.
Using diversification as part of your investment strategy neither assures nor guarantees better performance and cannot protect against loss of principal due to changing market conditions.
Past performance is not a guarantee of future results.
The opinions expressed in this commentary are those of the author and may not necessarily reflect those held by Kestra Investment Services, LLC or Kestra Advisory Services, LLC. This is for general information only and is not intended to provide specific investment advice or recommendations for any individual. It is suggested that you consult your financial professional, attorney, or tax advisor with regard to your individual situation.
Securities offered through Kestra Investment Services, LLC (Kestra IS), member FINRA/SIPC. Investment Advisory Services offered through Kestra Advisory Services, LLC (Kestra AS) an affiliate of Kestra IS. Kestra IS and Kestra AS are not affiliated with CD Wealth Management. Investor Disclosures: https://bit.ly/KF-Disclosures