The stock market’s positive momentum at the start of 2021 looked similar to its movement at the end of 2020, and through the first three weeks of January, the S&P 500 is up 2.4%, led by energy stocks. Among the reasons for the market’s recent performance: the potential for additional stimulus, low interest rates, an inflation target of 2% driven by the Federal Reserve and a tremendous amount of cash on the sidelines, waiting to be invested.
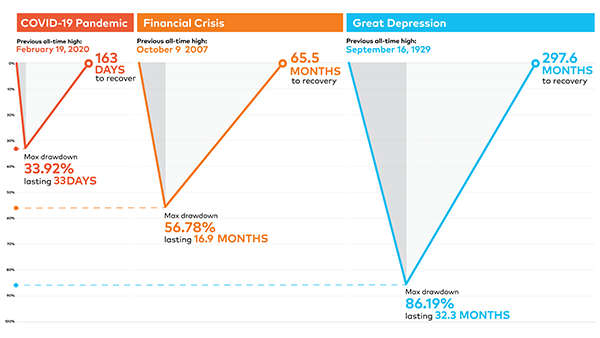
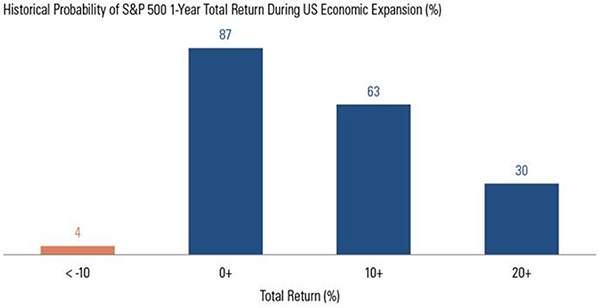
The S&P 500 has recovered over 70% from its March 2000 low. While investors may be concerned about the markets following this strong rally, history suggests there is more room to run. During past U.S. economic expansions, investors have enjoyed positive one-year returns 87% of the time. Drawdowns of greater than 10% occurred far less often — only 4% of the time.
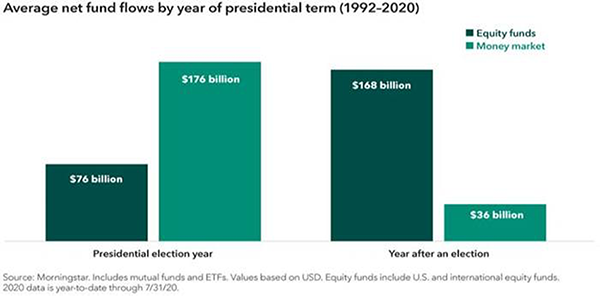
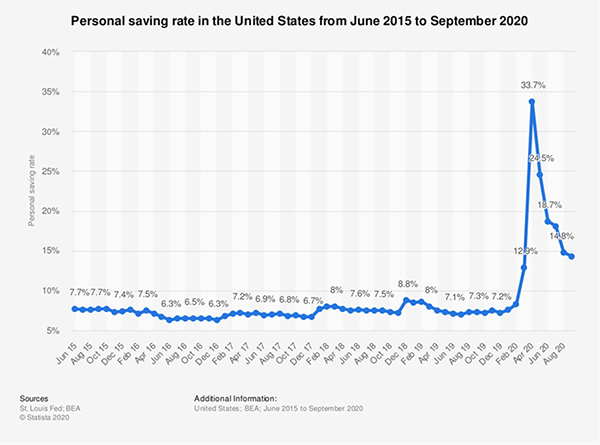
We understand why investors might look for reasons for the market to fall or correct itself; it can be tough to avoid the negative messages that constantly bombard us in today’s world. In all of our weekly newsletters, we discuss the importance of staying the course and sticking to your financial plan. With money market rates close to zero for an extended period of time, cash may not be a viable long-term investment, even with inflation below 2%.
Understanding what liquidity is and how it can impact portfolio returns can help you make more informed decisions. Liquidity is defined as the ease with which an investment can be bought or sold without significantly impacting the value of the underlying securities. Investments that can be easily bought or sold are said to be liquid. Traditional investments — like stocks (mutual funds, index funds and individual stocks) and bonds — can be bought and sold easily, so they are considered to be highly liquid. Illiquid assets are harder for investors to sell, harder to value and harder to control over how the assets are managed. For example, if you decide to sell your home today, you must go through a process to obtain your money. The house may not sell for months, and then you may have to reduce the asking price. Similarly, if you invest in a hedge fund or private equity investment, you may not have access to your funds on demand. There is a process to cash out, and it may take some time to liquidate — plus, the amount you receive could change based on market conditions.
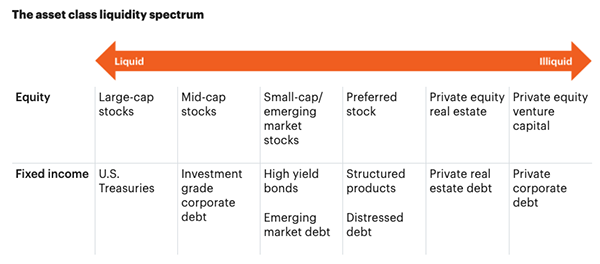
Our focus in managing our clients’ portfolios is in the publicly traded liquid markets. We provide access to those markets with a combination of individual stocks and bonds, index funds or exchange traded funds and mutual funds. If a crisis occurs and investors begin selling in mass, this can cause assets that are not as liquid to lead to further reduced value, as those investments are forced to sell into a market with a shortage of buyers. Liquidity, like volatility, needs to be managed in a portfolio, and by focusing on holdings that are extremely liquid, we look to reduce value disruption that may occur in market downturns.
So, what can we learn from all this? Having a well-balanced, diversified, liquid portfolio and a financial plan are keys to successful investing. The best option is to stick with a broadly diversified portfolio that can help you to achieve your own specific financial goals – regardless of market volatility. Long-term fundamentals are what matter. From an investment perspective, we use the above insights to help with the strategic and tactical asset allocation based on where we see the portfolio heading over the next five to seven years, with short-term adjustments along the way. We are not trying to time the market, but we will try to take advantage when we see where the market heading.

Sources: FS Investments, GSAM
_____
This material contains an assessment of the market and economic environment at a specific point in time and is not intended to be a forecast of future events, or a guarantee of future results. Forward-looking statements are subject to certain risks and uncertainties. Actual results, performance, or achievements may differ materially from those expressed or implied. Information is based on data gathered from what we believe are reliable sources.
Using diversification as part of your investment strategy neither assures nor guarantees better performance and cannot protect against loss of principal due to changing market conditions.
Past performance is not a guarantee of future results.
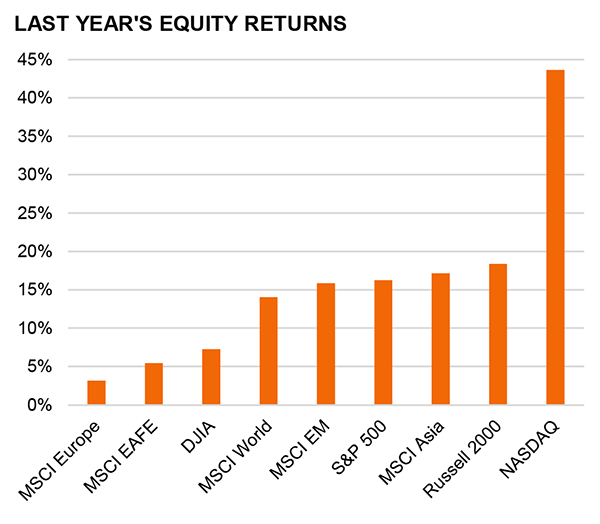
The MSCI Europe Index is a free float-adjusted market capitalization weighted index that is designed to measure the equity market performance of the developed markets in Europe. The MSCI EAFE Index (Europe, Australasia, Far East) is a free float-adjusted market capitalization index that is designed to measure the equity market performance of developed markets, excluding the US & Canada. The MSCI World Index is a free float-adjusted market capitalization weighted index that is designed to measure the equity market performance of developed markets. The MSCI Emerging Markets Index is a free float-adjusted market capitalization index that is designed to measure equity market performance of emerging markets. The MSCI AC (All Country) Asia ex Japan Index is a free float-adjusted market capitalization weighted index that is designed to measure the equity market performance of Asia, excluding Japan. The Dow Jones Industrial Average is a popular indicator of the stock market based on the average closing prices of 30 active U.S. stocks representative of the overall economy. S&P 500 Index is an unmanaged group of securities considered to be representative of the stock market in general. NASDAQ Composite Index measures all NASDAQ domestic and international based common type stocks listed on The NASDAQ Stock Market. The Russell 2000 Index measures the performance of the small-cap segment of the U.S. equity universe. It is not possible to invest directly in an index.
The opinions expressed in this commentary are those of the author and may not necessarily reflect those held by Kestra Investment Services, LLC or Kestra Advisory Services, LLC. This is for general information only and is not intended to provide specific investment advice or recommendations for any individual. It is suggested that you consult your financial professional, attorney, or tax advisor with regard to your individual situation.
Securities offered through Kestra Investment Services, LLC (Kestra IS), member FINRA/SIPC. Investment Advisory Services offered through Kestra Advisory Services, LLC (Kestra AS) an affiliate of Kestra IS. Kestra IS and Kestra AS are not affiliated with CD Wealth Management.