The election is over. Now what?

Although some recounts and legal action remain before the results of the election become official, news networks have projected that Joe Biden will be the nation’s 46th president — and markets have rallied over the past week, buoyed by additional clarity and less policy uncertainty.

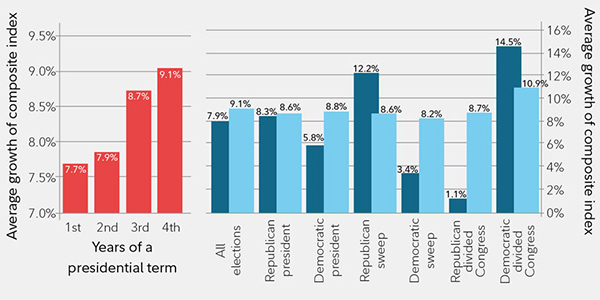
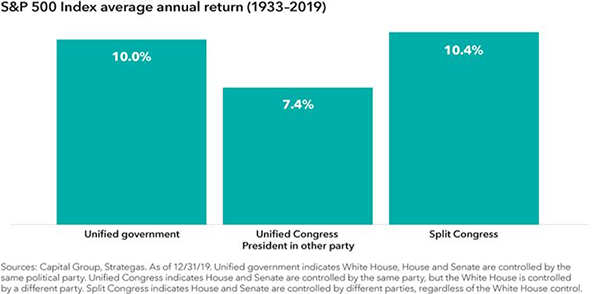
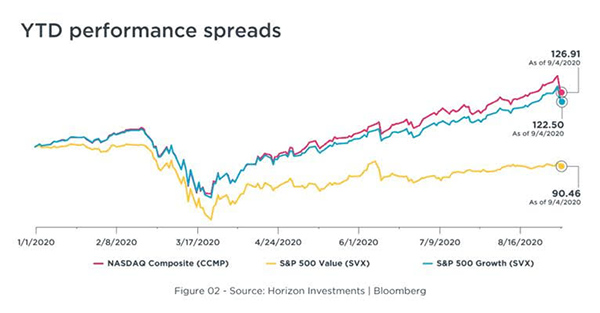
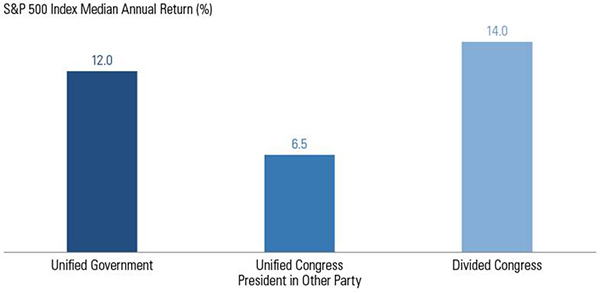
The S&P 500 rose 7.3% for the week last week. The strength continued this week with news from Pfizer on its vaccine efficacy and the hope that the world can return to “normal” in 2021. The predicted “blue wave” that some investors feared would unify the government and lead to significant policy shifts has evaporated — although legislative control remains up for grabs with a pair of Senate runoffs in Georgia coming in January. The chart below shows that since 1945, the S&P 500 has averaged a 14% annualized return with a divided Congress and a 12% return with a unified government. 

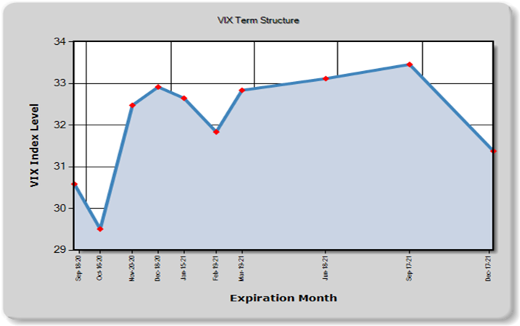
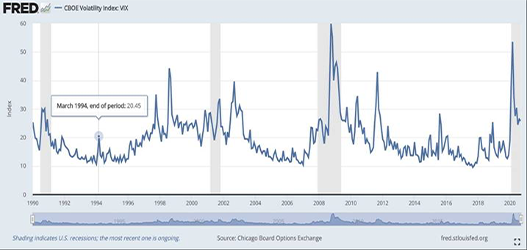
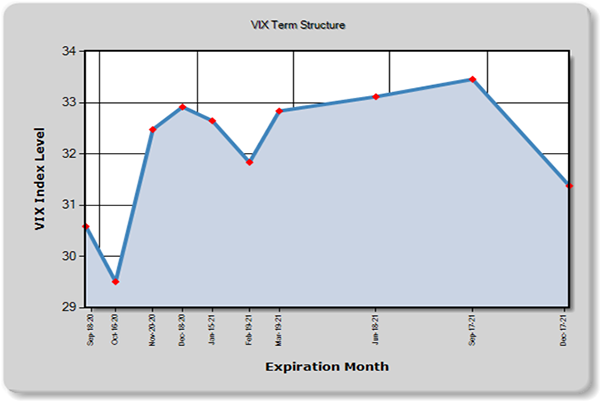
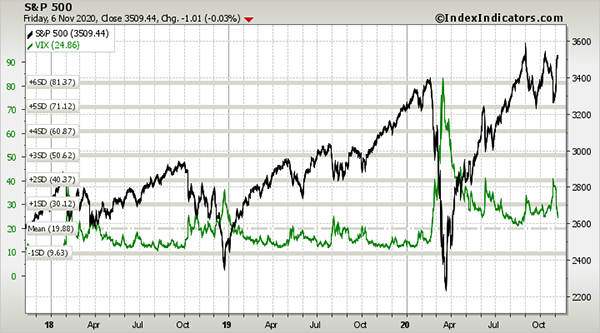
We received many calls leading up to the election from investors who were concerned about the possibility of higher volatility and a major market selloff after the election. As is often the case, however, the opposite occurred: We have seen volatility drop to levels last seen in August, and even before that, pre-pandemic levels. The chart below illustrates that volatility and market returns often move counter to each other. When volatility goes down, the stock market sees higher returns, and when volatility increases, stock market returns decrease.    

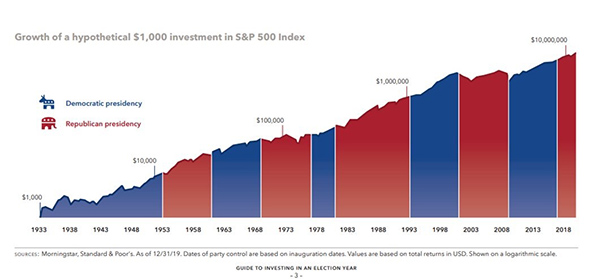
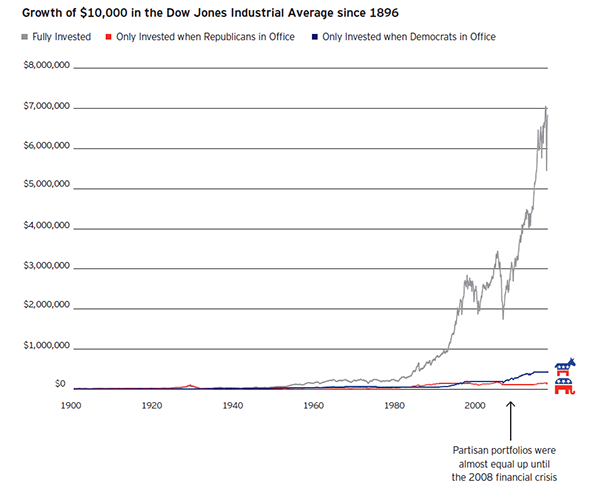
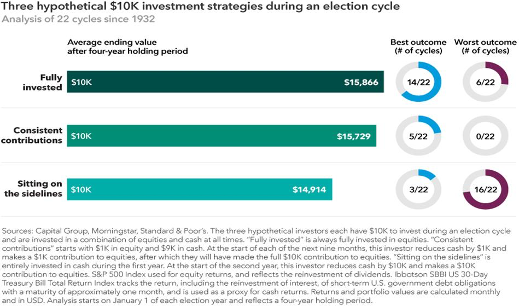
As we have discussed before, trying to time the market and make large bets seldom works out favorably. Market timing is rarely a winning strategy; staying invested is the key to long-term success. Historically, the best financial approach in election years is to stay invested, and we saw this play out again last week. Sticking with a long-term financial plan that is based on individual objectives while avoiding market timing around politics is usually the best course of action.

So, what can we learn from all this? 

Accurately predicting the next market move and timing the market is extremely difficult and can adversely affect the long-term performance of your portfolio. Riding out future market volatility in addition to having a diversified portfolio is sound strategy. It all starts with a solid financial plan for the long run that is based on your acceptable level of risk. The best option is to stick with a broadly diversified portfolio that can help you to achieve your own goals, regardless of market volatility. The economy, and therefore, the market, is bigger than the direction the political winds are blowing. Ultimately, it’s the long-term fundamentals that matter.

Data sources: GSAM, Index Indicators, Capital Group

_____

This material contains an assessment of the market and economic environment at a specific point in time and is not intended to be a forecast of future events, or a guarantee of future results.  Forward-looking statements are subject to certain risks and uncertainties.  Actual results, performance, or achievements may differ materially from those expressed or implied.  Information is based on data gathered from what we believe are reliable sources.

S&P 500 Index is an unmanaged group of securities considered to be representative of the stock market in general.  You cannot directly invest in the index.The opinions expressed in this commentary are those of the author and may not necessarily reflect those held by Kestra Investment Services, LLC or Kestra Advisory Services, LLC.  This is for general information only and is not intended to provide specific investment advice or recommendations for any individual.  It is suggested that you consult your financial professional, attorney, or tax advisor with regard to your individual situation. 
 
Securities offered through Kestra Investment Services, LLC (Kestra IS), member FINRA/SIPC. Investment Advisory Services offered through Kestra Advisory Services, LLC (Kestra AS) an affiliate of Kestra IS. Kestra IS and Kestra AS are not affiliated with CD Wealth Management.

Click here for additional investor disclosures.

Profits, Profits, Profits

On the heels of a record decrease in gross domestic product (GDP) for the second quarter, the U.S. economy rebounded swiftly with a record increase in the third quarter. GDP — the amount spent by U.S. consumers during a given period — climbed 33.1% from July through September after taking a 31.4% tumble from April through June.

While pent-up demand for consumer goods and better manufacturing activity drove that growth, the U.S. economy remains about 4% lower than last year’s levels, and service sectors such as hospitality, restaurants and airlines remain under pressure.

As the economy rebounded in the third quarter, so too did profits. So far, almost 72% of the companies in the S&P 500 have reported earnings for the third quarter. Of those, 87% exceeded earnings estimates, and 77% beat revenue estimates, well above long-term averages. 

It is possible that analysts set the bar too low for the third quarter, though, as sectors such as energy and financials are seeing positive earnings surprises despite being lower than a year ago. The chart below shows that each sector in the S&P 500 had better than expected earnings for the third quarter.

Although the economy is recovering from the shutdown in March and April, the road to recovery continues to be challenging. Consumer staples, technology and health care are expected to see positive earnings growth on a year-over-year basis. Other sectors, like financials and energy, are expected to decline year over year. However, as the chart above illustrates, banks and energy companies have reported stronger revenues and earnings than anticipated. 

Bank profits have been better than expected with strong trading revenues from asset management as well as lower-than-expected loan-loss provisions. As the chart below shows, current losses stand at 8.3% of sales for banks, compared to 19.7% of sales in aftermath of the Global Financial Crisis. Even with rates at or near zero, the financial companies are able to limit their loan losses and therefore, deliver positive earnings to the bottom line.

With 2020 earnings generally better than expected and earnings season more than two-thirds complete, where do we go from here?  Although the current environment feels more uncertain than normal with the election as well as the COVID-19 pandemic, the best approach to investing in the markets remains one of balance and maintaining asset allocation that meets your individual risk tolerance. As we have written several times over the last few months, the markets do not care about election results; they favor certainty and profits. Historically, markets have performed very similarly regardless of which party controls the White House.

What does this mean for you? 

Having a mix of growth and value stocks, large stocks and small stocks, U.S. stocks and international stocks and bonds while staying the course has always made the most sense for investors. 

Remember that market downturns offer the chance to buy stocks at lower prices, which could position a portfolio well for future growth. If we experience volatility due to election turmoil, we will follow your financial plan and ignore the noise. There are no guarantees that stocks will perform to anyone’s expectations, and decisions could result in losses including a possible loss in principal. However, it may be helpful to remember that some investors use downturns as opportunities to buy stocks that were previously overvalued relative to their perceived earnings potential.

Data Sources: FactSet, JP Morgan Asset Management, Invesco

_____

This material contains an assessment of the market and economic environment at a specific point in time and is not intended to be a forecast of future events, or a guarantee of future results.  Forward-looking statements are subject to certain risks and uncertainties.  Actual results, performance, or achievements may differ materially from those expressed or implied.  Information is based on data gathered from what we believe are reliable sources.

S&P 500 Index is an unmanaged group of securities considered to be representative of the stock market in general.  You cannot directly invest in the index.The opinions expressed in this commentary are those of the author and may not necessarily reflect those held by Kestra Investment Services, LLC or Kestra Advisory Services, LLC.  This is for general information only and is not intended to provide specific investment advice or recommendations for any individual.  It is suggested that you consult your financial professional, attorney, or tax advisor with regard to your individual situation. 
 
Securities offered through Kestra Investment Services, LLC (Kestra IS), member FINRA/SIPC. Investment Advisory Services offered through Kestra Advisory Services, LLC (Kestra AS) an affiliate of Kestra IS. Kestra IS and Kestra AS are not affiliated with CD Wealth Management.

Click here for additional investor disclosures.

Presidents and portfolios

We are now a few days from the election, and we are receiving calls and emails from clients who are wondering if they should make changes to their portfolios before the results come in. History suggests election results should not be the primary driver of investment decisions; this is especially true this year, with the pandemic and the fiscal and monetary response from the Federal Reserve driving the markets. While the election certainly will have an impact on the country, we caution against taking drastic action in the world of investing.

Market commentators — and presidents themselves — have cited the stock market’s performance as a measuring stick of White House policies, but the data doesn’t support this, as seen in the chart below.

Instead, the key drivers of stock market performance are the fundamentals of earnings, interest rates, job growth and productivity. Policy changes do have ramifications for financial plans, tax strategy and estate planning, but not when it comes to day-in, day-out asset allocation.

We want you to keep these thoughts in mind as we enter the home stretch of the election:

1. Markets have performed well under both parties. As the light blue bars show in the chart below, the markets have yielded positive returns, no matter which party controls the White House or Congress, over a four-year presidential cycle. 

2. Investors are better off staying fully invested. The best-performing portfolio over the past 120 years was one that stayed fully invested through both Democratic and Republican administrations.

3. Monetary policy matters more than who occupies the White House. Historically, presidents have been hurt or helped by monetary policy conditions. Both President Reagan and President Clinton benefited from consistently falling interest rates. Both President George H.W. Bush and President George W. Bush were hurt by Fed tightening, an inverted yield curve and a recession. President Obama benefited from a benign rate environment during his term (minus a brief moment in 2015–2016), and President Trump experienced tighter policy during his first two years, but the last two years have seen rates return to zero. The adage “Don’t fight the Fed” rings true.

4. Don’t confuse politics with market analysis. Some of the best returns in the market came when the presidential approval rating was in the low range of between 36% and 50%.

What does this mean for you?

Investors have prospered in markets during difficult political times. The average return of the S&P 500 since the end of World War II is almost 11%. Staying the course has always made the most sense for investors. Follow your financial plan and ignore the noise.

Remember that market downturns offer the chance to buy stocks at lower prices, which could position a portfolio well for future growth. Again, there are no guarantees that stocks will perform to anyone’s expectations, and decisions could result in losses including a possible loss in principal. However, it may be helpful to remember that some investors use downturns as opportunities to buy stocks that were previously overvalued relative to their perceived earnings potential.

_____

This material contains an assessment of the market and economic environment at a specific point in time and is not intended to be a forecast of future events, or a guarantee of future results.  Forward-looking statements are subject to certain risks and uncertainties.  Actual results, performance, or achievements may differ materially from those expressed or implied.  Information is based on data gathered from what we believe are reliable sources.

S&P 500 Index is an unmanaged group of securities considered to be representative of the stock market in general.  You cannot directly invest in the index.
The opinions expressed in this commentary are those of the author and may not necessarily reflect those held by Kestra Investment Services, LLC or Kestra Advisory Services, LLC.  This is for general information only and is not intended to provide specific investment advice or recommendations for any individual.  It is suggested that you consult your financial professional, attorney, or tax advisor with regard to your individual situation. 
 
Securities offered through Kestra Investment Services, LLC (Kestra IS), member FINRA/SIPC. Investment Advisory Services offered through Kestra Advisory Services, LLC (Kestra AS) an affiliate of Kestra IS. Kestra IS and Kestra AS are not affiliated with CD Wealth Management.

Click here for additional investor disclosures.

3 strategies for tax savings, no matter who wins the election

With the presidential and congressional elections less than three weeks away, many investors are wondering if a new administration and a new Congress might pass tax reforms that alter the current tax landscape. After the Nov. 3 elections, we will get a better sense of the potential for tax reform, but in the interim, we continue to look for opportunities to bolster tax savings for our clients, regardless of who takes office in 2021.

Strategy No. 1: Tax Loss Harvesting

Under current tax law, it’s possible to offset current capital gains with capital losses you’ve incurred during the year or carried over from a prior tax return. Capital gains are the profits you realize when you sell an investment for more than you paid for it, while capital losses are the losses you realize when you sell an investment for less than you paid for it. Short-term capital gains are taxed as ordinary income rates, whereas long-term capital gains are taxed at a lower capital gains rate. The chart above displays the historical gap between maximum individual tax rate and maximum capital gains tax rate, including the 3.8% tax on net investment income.

As seen in the chart, the current spread between the two tax rates is not that wide. However, the ability to reduce the tax on both short-term and long-term capital gains by harvesting losses can help offset the gains one incurs from taking profits. Harvesting the loss has no effect on the portfolio value, as one can use the proceeds from the sale to buy a similar investment. This allows the investor to maintain similar asset allocation and reduce federal income taxes, as seen in the example below. Throughout the year, we continue to look for opportunities to harvest losses and take profits, all while maintaining the current risk tolerance.

Tax-loss harvesting and portfolio rebalancing can provide nice synergies as they play different roles in portfolio management. When we rebalance a portfolio, we are managing risk in the portfolio by selling holdings that have outsized their target holdings and adding those gains to positions that may have losses or not grown as much. Often in rebalancing, the portfolio will experience sizeable capital gains. That’s where tax-loss harvesting helps reduce the gains and brings the risk of the portfolio back to its target allocation.
 
Strategy No. 2: Converting to a Roth IRA
 
A traditional IRA/401K is funded with pre-tax contributions. Future withdrawals from your IRA/401K are then taxed at ordinary income rates. A Roth IRA/401K is funded with after-tax dollars and the withdrawals are tax-free, if the qualifications are satisfied. Individuals who have a majority of their retirement assets in traditional IRA/401K might consider converting a portion of those assets to a Roth retirement account for “tax diversification.” With tax rates currently at historically favorable levels, now might be an opportune time to do a Roth conversion as the IRS treats Roth IRA conversions as taxable income.  

Strategy No. 3: Increasing charitable contributions

The Tax Cuts and Jobs Act passed in 2017 increased the deduction limit for cash contributions made to public charities to 60% of Adjusted Gross Income from 50%. The CARES Act, passed earlier this year due to the global pandemic, provided additional tax relief to those individuals donating to charity in 2020. For this tax year, taxpayers can elect on their 2020 income tax return to deduct up to 100% of adjusted gross income for cash gifts made to public charities.

Also, under the CARES Act, taxpayers can gift long-term appreciated securities to public charities (including donor advised funds) up to 30% of their adjusted gross income while also making cash gifts to public charities totaling up to 70% of adjusted gross income. For those who are charitably inclined, 2020 offers an opportunity to donate more to your favorite charities and potentially reduce your taxable income.

What does this mean for you?

We will continue to monitor the financial plan and the portfolios to look for opportunities to tax-loss harvest, discuss Roth IRA conversions and potentially donate appreciated stock to your favorite charities. We remain hypervigilant going into the election and will make tweaks to the portfolios when necessary.

_____

This material contains an assessment of the market and economic environment at a specific point in time and is not intended to be a forecast of future events, or a guarantee of future results.  Forward-looking statements are subject to certain risks and uncertainties.  Actual results, performance, or achievements may differ materially from those expressed or implied.  Information is based on data gathered from what we believe are reliable sources.

S&P 500 Index is an unmanaged group of securities considered to be representative of the stock market in general.  You cannot directly invest in the index.
The opinions expressed in this commentary are those of the author and may not necessarily reflect those held by Kestra Investment Services, LLC or Kestra Advisory Services, LLC.  This is for general information only and is not intended to provide specific investment advice or recommendations for any individual.  It is suggested that you consult your financial professional, attorney, or tax advisor with regard to your individual situation. 
 
Securities offered through Kestra Investment Services, LLC (Kestra IS), member FINRA/SIPC. Investment Advisory Services offered through Kestra Advisory Services, LLC (Kestra AS) an affiliate of Kestra IS. Kestra IS and Kestra AS are not affiliated with CD Wealth Management.

Click here for additional investor disclosures.

Do deficits matter anymore?

Among the financial damage from the coronavirus pandemic has been the large increase in the federal budget. The pandemic has caused massive economic disruption, and the U.S. government deficit has soared, as COVID-related fiscal stimulus is still being required. 

However, Americans appear to be less concerned about the deficit than in recent years. A recent Pew study reflects that in June 2020, only 47% of Americans viewed the deficit as a large problem, compared with 55% just two years ago. In fact, clients often ask us, “What should we do about the growing deficit  — and with interest rates so low, do deficits really matter anymore?”

Federal Reserve policies, including low interest rates and quantitative easing (QE), have enabled the government to increase stimulus spending with little risk for now. With all of the challenges facing the economy, the Fed has allowed the government to issue new debt with interest rates at historically low levels. This is very similar to homeowners continually refinancing their home mortgages as rates continue moving lower. Often, homeowners will take equity out of their house when they refinance, increasing what they owe to the bank but lowering their overall payments since their new interest rate has decreased.

With interest rates having been on the decline for many years, and with the Fed’s recent statements pointing toward keeping them lower for years to come, servicing a higher deficit seems to cost relatively little. As seen in the chart below, the federal deficit has risen to almost 15% of GDP as fiscal stimulus was needed along with a plunge in GDP growth due to the economic shutdown. Congress is negotiating how much more stimulus will be needed to help businesses that are still affected by the global pandemic. 

But with rates low, servicing a higher deficit level costs much less. In 1996, interest payments accounted for 15.4% of total federal spending. In 2019, the federal government paid out $375 billion of interest on its debt, accounting for 8.4% of total federal spending.

The bigger question remains with state and local government deficits, which have increased as well during the crisis. Tax revenues have decreased and unemployment insurance costs have risen as the unemployment rate currently sits at 7.9%. City and state spending have accounted for more of GDP spending than the federal government; local governments employ more workers than the federal government.  

However, state and local governments must balance their operating budgets every year and can’t borrow to finance large deficits. To date, federal aid has exceeded projected revenue losses, but unless the federal government continues to support local economies, projected shortfalls are forecasted for years to come. If aid to the states and local governments is not in the upcoming stimulus package, states will cut back their spending and in turn will restrain the vigor of economic recovery.  

Tax policy in the next four years remains uncertain with the looming election. Regardless of who occupies the White House, state and local taxes could rise in the coming years to fill the budget shortfalls created by the pandemic. These shortfalls could hinder economic recovery in the near term, just as after the great recession of 2007-2009, local governments’ spending didn’t support their economies for five years after the recession.   

Today’s borrowing is largely appropriate and necessary in order to reduce the economic pain caused by the COVID-19 pandemic. Once the pandemic ends and the economy is on its way to recovery, policymakers will turn their focus to long-term debt and deficit reduction to get the country on solid fiscal ground. Even as the level of debts rise, the cost of carrying the debt, reflected with low interest rates, has tumbled. Financial markets have maintained confidence in the ability for the U.S. to carry the financial burdens. As The New York Times put it, “The economy has not drowned in the flood of red ink – and there’s a growing sense that the country could take on even more without any serious consequence.”1

What does this mean for you?

Follow your financial plan and ignore the noise. Remember that market downturns offer the chance to buy stocks at lower prices, which could position a portfolio well for future growth. Again, there are no guarantees that stocks will perform to anyone’s expectations, and decisions could result in losses including a possible loss in principal. But it may be helpful to remember that some investors use downturns as opportunities to buy stocks that were previously overvalued relative to their perceived earnings potential.

Data Sources: Pew Research Center, UsgovernmentSpending.com, FS Investments

New York Times – August 21, 2020 – We have crossed the line Debt Hawks Warned Us about for Decades

_____

This material contains an assessment of the market and economic environment at a specific point in time and is not intended to be a forecast of future events, or a guarantee of future results. Forward-looking statements are subject to certain risks and uncertainties. Actual results, performance, or achievements may differ materially from those expressed or implied. Information is based on data gathered from what we believe are reliable sources.

Using diversification as part of your investment strategy neither assures nor guarantees better performance and cannot protect against loss of principal due to changing market conditions.

Past performance is not a guarantee of future results.

The opinions expressed in this commentary are those of the author and may not necessarily reflect those held by Kestra Investment Services, LLC or Kestra Advisory Services, LLC. This is for general information only and is not intended to provide specific investment advice or recommendations for any individual. It is suggested that you consult your financial professional, attorney, or tax advisor with regard to your individual situation.

Securities offered through Kestra Investment Services, LLC (Kestra IS), member FINRA/SIPC. Investment Advisory Services offered through Kestra Advisory Services, LLC (Kestra AS) an affiliate of Kestra IS. CD Wealth Management and Bluespring Wealth Partners LLC* are affiliates of Kestra IS and Kestra AS.  Investor Disclosures: https://bit.ly/KF-Disclosures

*Bluespring Wealth Partners, LLC acquires and supports high quality investment adviser and wealth management companies throughout the United States.

3 reasons pandemic shutdowns seem unlikely

The news last week that President Trump has COVID-19 has shifted the narrative back to the potential risk of a second wave of COVID-19 lockdowns. If this were to occur, we would see a return to recession for the global economy and a bear market for stocks. 

Even as virus cases are on the rise around the world, as seen by Israel instituting a second national lockdown, the United Kingdom rolling out new restrictions, and new cases in France and Spain prompting politicians to consider similar measures, we believe that a return to widespread national lockdowns is unlikely for three reasons:

1. Healthcare systems are not overwhelmed.

The outbreak in Europe today is different from the outbreak in March and April, as it has not been accompanied by a spike in hospital admissions. At the same time, the hospitalization rate in the U.S. has fallen sharply, according to the U.S. Centers for Disease Control. The rise in new cases in Europe is not alarming when viewed as a percentage of those being tested, as seen in the chart below. The percentage of positive tests is trending upward mainly in France and Spain.

2. Huge economic costs are a factor.

The high economic and social costs make it more likely that governments will respond to new outbreaks with effective targeted restrictions rather than national lockdowns. Countries that deployed lockdowns earlier this year experienced large declines in economic activity, tens of millions of lost jobs and stock market declines.

3. Localized restrictions are paying off.

The U.S. experienced a spike in COVID-19 cases this summer. However, as seen in the chart below, the return of targeted restrictions in some states did not lead the economy back into a recession. In fact, the labor market continued to improve over the summer months, recovering almost half the jobs lost in March and April.

China also saw surges in cases in parts of its country and used localized and targeted restrictions. The International Monetary Fund now predicts that China will be the only country in the world to grow its economy, even though it experienced the first wave of COVID-19 at the beginning of the year, and then a second wave this summer.

What does this mean for you?

Continuing to focus on the fundamentals can help you weather the potential market response to an uptick in coronavirus cases. Follow your financial plan and ignore the noise. Remember that market downturns offer the chance to buy stocks at lower prices, which could position a portfolio well for future growth. There are no guarantees that stocks will perform to anyone’s expectations, and decisions could result in losses including a possible loss in principal, but it may be helpful to remember that some investors use downturns as opportunities to buy stocks that were previously overvalued relative to their perceived earnings potential.

Moreover, if you typically invest set amounts into your portfolio at regular intervals — a strategy known as dollar-cost averaging (DCA), which is commonly used in workplace retirement plans and college investment plans — you are using a method of investing that helps you behave like the value investors mentioned above. Through DCA, your investment dollars purchase fewer shares when prices are high, and more shares when prices drop. Over extended periods of volatility, DCA can result in a lower average cost for your holdings than the investment’s average price over the same time period.  DCA does not assure a profit or protect against a loss in declining markets.

We will continue to stay the course, just like we did during the national lockdown in March and April.  We remain hypervigilant going into the 4th quarter and will make tweaks to the portfolios when necessary.

Sources: Bloomberg, Charles Schwab, European CDC

_____

This material contains an assessment of the market and economic environment at a specific point in time and is not intended to be a forecast of future events, or a guarantee of future results.  Forward-looking statements are subject to certain risks and uncertainties.  Actual results, performance, or achievements may differ materially from those expressed or implied.  Information is based on data gathered from what we believe are reliable sources.

The opinions expressed in this commentary are those of the author and may not necessarily reflect those held by Kestra Investment Services, LLC or Kestra Advisory Services, LLC.  This is for general information only and is not intended to provide specific investment advice or recommendations for any individual.  It is suggested that you consult your financial professional, attorney, or tax advisor with regard to your individual situation.  

Securities offered through Kestra Investment Services, LLC (Kestra IS), member FINRA/SIPC. Investment Advisory Services offered through Kestra Advisory Services, LLC (Kestra AS) an affiliate of Kestra IS. Kestra IS and Kestra AS are not affiliated with CD Wealth Management. 

Countdown to the election: How will it affect your portfolio?

Now that we are in October and entering the 4th quarter of 2020, everyone’s focus has turned to the upcoming election and how that may impact their portfolio returns. We continue to focus on our clients’ long-term investment plan and on not letting the outside noise affect prudent investment strategies. Historically, whether the incumbent wins or loses, election volatility has usually been short-lived and has quickly given way to upward-moving markets.

One of the concerns investors have during this investment cycle is a potential sweep by the Democrats leading to a reversal of policies, such as deregulation or tax cuts. Assuming that such an outcome will lead to lower stock prices is over-simplifying the stock markets and their forward-looking abilities. History shows that stocks have done well regardless of which party is in control, as seen in the chart below. The “least good” outcome has been when Congress is controlled by the opposite party of the White House, but even this scenario has provided a 7.4% average return. Voters can take comfort that whether the government is unified under one party or led by a split Congress, all scenarios historically have provided positive equity returns.

Politics can bring out strong emotions, as seen by the debate this week, but investors need to stay focused on the long term. Which party is in power hasn’t made a meaningful difference to stocks. Over the last 85 years, the general direction of the market has been up, whether the president is Republican or Democrat. What should matter more than the results is staying invested to benefit from the markets moving higher. Each election is important and unique in its own way, and the chart below shows that markets continue to be resilient amid uncertainty, so maintaining long-term focus is critical.

We understand that it can be tough to avoid the negative messages and the noise that constantly bombards us in today’s world. History has shown that elections have had an impact on investor behavior; in election years, investors tend to add money to cash, and then immediately following an election, monies flow into equities as seen in the chart below.

This suggests that investors want to minimize risk during election years and wait until uncertainty has subsided to reinvest their monies into stocks. However, market timing is rarely a winning strategy, and staying invested is the key to long-term success. Historically, the best way to invest in election years is to stay invested. Sticking with a long-term financial plan based on individual objectives and avoiding market timing around politics is usually the best course of action.

What can we learn from all this? The best option is to stick with a broadly diversified portfolio that can help you to achieve your own specific financial goals – regardless of who prevails in next month’s election. The economy, and therefore the market, is bigger than the direction that the political winds are currently blowing. Ultimately, it’s the long-term fundamentals that matter. Now more than ever, it is important to maintain an investment strategy based on your own goals, time horizon and risk tolerance.

Data Sources: Capital Group, Strategas, Morningstar, Standard & Poor’s

_____

This material contains an assessment of the market and economic environment at a specific point in time and is not intended to be a forecast of future events, or a guarantee of future results. Forward-looking statements are subject to certain risks and uncertainties. Actual results, performance, or achievements may differ materially from those expressed or implied. Information is based on data gathered from what we believe are reliable sources.

Using diversification as part of your investment strategy neither assures nor guarantees better performance and cannot protect against loss of principal due to changing market conditions.

Past performance is not a guarantee of future results.

The opinions expressed in this commentary are those of the author and may not necessarily reflect those held by Kestra Investment Services, LLC or Kestra Advisory Services, LLC. This is for general information only and is not intended to provide specific investment advice or recommendations for any individual. It is suggested that you consult your financial professional, attorney, or tax advisor with regard to your individual situation.

Securities offered through Kestra Investment Services, LLC (Kestra IS), member FINRA/SIPC. Investment Advisory Services offered through Kestra Advisory Services, LLC (Kestra AS) an affiliate of Kestra IS. CD Wealth Management and Bluespring Wealth Partners LLC* are affiliates of Kestra IS and Kestra AS.  Investor Disclosures: https://bit.ly/KF-Disclosures

*Bluespring Wealth Partners, LLC acquires and supports high quality investment adviser and wealth management companies throughout the United States.

Coping with volatility in the market

As we approach the fourth quarter of 2020 and the upcoming presidential election, many investors are asking about volatility and how to potentially hedge the portfolio against future volatility.
 
In previous messages, we have discussed the volatility index, VIX, which is a measure of forward-looking volatility for the next 30 days. The VIX is known as the fear gauge, as it reflects the market’s short-term outlook for stock price volatility as derived from option prices on the S&P 500. The challenge with the VIX index is that investors can’t access the VIX index; you can’t purchase it. 
 
In a chart that we recently shared on volatility, higher volatility looks like it will last into next year, regardless of the election outcome or the arrival of a vaccine against COVID-19. 

The VIX can remain elevated long after the depths of a crisis. For example, for most of 2009, the index hovered in the mid-20s range. A reading below 20 in the VIX suggests investors perceive market risk to be low, while a reading above 30 indicates more nervousness in the market. The VIX has been trading between 25 and 30 for most of September 2020.

The chart above clearly highlights the large moves to the upside in the VIX index– 1998 Long Term Capital Management blow up, 2000 tech bubble, 2008-2009 financial crisis, 2011 downgrade of US debt, and most recently the COVID-19 pandemic. So the question still remains, how does one protect themselves from increased volatility in their portfolio? If we could, the easy answer would be to buy the VIX index as a hedge in the portfolio to guard against increased market volatility leading to the stock market going down. 
 
However, as we previously stated, investors can’t purchase the VIX index.  Some investors purchase complicated index funds that attempt to replicate the volatility index through futures-based pricing or invest in hedge funds or other alternative investments, while others trade options – all in the “hope” of mitigating risk or volatility. All the above, however, have significant risk and investment challenges and none are the panacea for increased market volatility.

We believe that the key is to stay the course and not try to time the market.  It all starts with a solid financial plan for the long run that understands the level of risk that is acceptable for each client. With regards to investments, we believe in diversification and having different asset classes that allow you to stay invested. The best option is to stick with a broadly diversified portfolio that can help you to achieve your own specific financial goals – regardless of market volatility. The economy, and therefore, the market, is bigger than the direction the political winds are blowing. Ultimately, it’s the long-term fundamentals that matter.
 
We want our clients to continue to focus on the following as we will continue staying the course of their financial plans and being proactive to make specific strategic moves in the portfolios that have proven necessary during these times:

Revisit Your Investment & Financial Planning Objectives: For nearly all investors, longer-term objectives are made possible when taking an appropriate level of risk.

Continue to Maintain a Longer-Term Mindset: Avoid letting recent market volatility convince you to abandon your prudently designed, long-term investment plan. Short-term reactive decisions could significantly impair portfolio returns.

Excess Cash Reserves: Continue to contribute according to your periodic investment plans as investing a portion of your excess cash reserves.

_____

This material contains an assessment of the market and economic environment at a specific point in time and is not intended to be a forecast of future events, or a guarantee of future results.  Forward-looking statements are subject to certain risks and uncertainties.  Actual results, performance, or achievements may differ materially from those expressed or implied.  Information is based on data gathered from what we believe are reliable sources.

The opinions expressed in this commentary are those of the author and may not necessarily reflect those held by Kestra Investment Services, LLC or Kestra Advisory Services, LLC.  This is for general information only and is not intended to provide specific investment advice or recommendations for any individual.  It is suggested that you consult your financial professional, attorney, or tax advisor with regard to your individual situation.

Securities offered through Kestra Investment Services, LLC (Kestra IS), member FINRA/SIPC. Investment Advisory Services offered through Kestra Advisory Services, LLC (Kestra AS) an affiliate of Kestra IS. Kestra IS and Kestra AS are not affiliated with CD Wealth Management.

A deeper look at the stock selloff

Last week was a good reminder that stocks cannot go up all the time. The previous five weeks saw signs of investor exuberance after both Apple and Tesla announced stock splits and market volatility continued to drop at the same time. 

The same stocks that led the NASDAQ and S&P 500 higher were the same ones that fell the most last week. As seen in the chart below, Large Cap Growth stocks and the NASDAQ, since the market bottom in March, have significantly outpaced value stocks, and the selloff last week is an effort to reduce the spreads between growth and value stocks.

The reasons for the market pullback were the usual reasons: slowing recovery, tech stock bubble and an upcoming election. We do not think that the selloff last week is the beginning of a correction. 

When stock valuations get stretched, as they recently have in the technology sector, they tend to snap back, much like a rubber band. If markets move too far in one direction, either oversold or overbought, they typically need to “reset” before moving higher, what many call profit taking. However, much of the volatility last week is being blamed on offshore funds option trading that led to large amounts of technology stock options being purchased. If this is the case, we expect this to be nothing more than a short-term move down in the markets.

The VIX Index, which is a measure of forward volatility for the next 30 days, is flashing higher volatility than normal. The election is a big reason that the forward curve of the VIX index is steep as seen below. After we know who the next president will be, volatility is expected to level off.

While the market sold off last week, we saw interest rates rise and gold prices fall. This is not typical behavior of a market correction. Employment data continues to improve as the unemployment rate fell to 8.4 percent, well below expectations, and down from the high of 22 percent back in April. 

The improvement in the labor market has been an unexpected source of strength for the economy. The expectation is that the pace of the rebound will begin to moderate, however, the pace of recovery remains ahead of forecast.

What to watch next

Now that Labor Day is behind us, the focus for the markets turns to stimulus talks and the election. Last week, Congress passed a resolution on the budget to avoid a government shutdown. It also may mean that stimulus talks may be stalled for the rest of the year. The markets will be watching the political scene closely and will dominate the news well beyond Nov. 3.

So, what can we learn from all this?  Staying the course during periods of market volatility is critical for the long-term success of your financial plan. We will continue to closely track the markets, the sector rotation and continue to tweak the portfolios as necessary.

This material contains an assessment of the market and economic environment at a specific point in time and is not intended to be a forecast of future events, or a guarantee of future results. Forward-looking statements are subject to certain risks and uncertainties. Actual results, performance, or achievements may differ materially from those expressed or implied. Information is based on data gathered from what we believe are reliable sources.

Using diversification as part of your investment strategy neither assures nor guarantees better performance and cannot protect against loss of principal due to changing market conditions.

Past performance is not a guarantee of future results.

The opinions expressed in this commentary are those of the author and may not necessarily reflect those held by Kestra Investment Services, LLC or Kestra Advisory Services, LLC. This is for general information only and is not intended to provide specific investment advice or recommendations for any individual. It is suggested that you consult your financial professional, attorney, or tax advisor with regard to your individual situation.

Securities offered through Kestra Investment Services, LLC (Kestra IS), member FINRA/SIPC. Investment Advisory Services offered through Kestra Advisory Services, LLC (Kestra AS) an affiliate of Kestra IS. CD Wealth Management and Bluespring Wealth Partners LLC* are affiliates of Kestra IS and Kestra AS.  Investor Disclosures: https://bit.ly/KF-Disclosures

*Bluespring Wealth Partners, LLC acquires and supports high quality investment adviser and wealth management companies throughout the United States.

What’s behind the Fed’s inflation policy change?

Last week, the Federal Reserve bank announced to the market a change that has been a few years in the making. The Fed will no longer be strictly beholden to a 2 percent inflation target or an employment mandate. 

As seen by the chart below, inflation has exceeded the 2 percent target only 13 percent of the time in the last five years. In 2018, the Fed raised rates consistently until the market dropped almost 20 percent in the fourth quarter and then reversed course in January 2019.

Going forward, the Federal Reserve will target an average inflation rate of 2 percent over time. Average inflation targeting implies that when inflation is below the 2 percent level for a period of time, the Fed will work to push inflation over the target level for an unknown period of time to compensate for the lower inflation level. 

The Fed did not specify over what period of time it will seek to maintain the average inflation above or below 2 percent or what tools it may use to achieve its goals.

The Fed currently relies on three main tools of monetary policy:

1. Adjustments to short-term interest rates

2. Quantitative easing

3. Forward guidance

Adjustments to the Fed Funds rate have long been the standard instrument for tightening or loosening the supply of money in circulation, incentivizing people to either save or spend more. Quantitative easing is when large-scale asset purchases are made by the central bank to put downward pressure on longer-term interest rates, making monetary policy more accommodative. Forward guidance is the path of future short-term rates.

Other central banks also use negative interest rates as a monetary policy tool; however, the Federal Reserve bank does not believe that this is a desirable option. Despite the amount of money that central banks around the world have added to the economy since the global financial crisis, inflation has remained low. The world has witnessed Japan having very aggressive monetary policy for 30 years with no resulting inflation or growth.

The Fed also is embracing the idea that the economy can allow unemployment rates to head much lower without adverse consequences on consumer prices and worrying that if we become fully employed again, as we were pre-pandemic, it will have to raise rates because of fear of inflation. 

Given that inflation is below the current 2 percent target and unemployment is still high due to the pandemic, the changes that the Fed made are not likely to have any big, immediate impact on monetary policy decisions. As the economy recovers, the new statement suggests that the Fed will be holding off on tightening the money supply even if unemployment falls back to the pre-pandemic levels and inflation rises above the 2 percent target. 

The implication of the policy change is that the Fed will not be hiking interest rates for years. How long exactly is unknown, and only time will tell, but the next policy review is in five years, and many think that is a logical timeline. 

What does this mean for equity and fixed income markets? This new policy stance is more supportive for equity and bond markets and negative for the U.S. dollar. 

So what can we learn from all this? The investment maxim of “don’t fight the Fed” will take on new meaning as we will watch and see how the Fed will respond with its new policy.

This material contains an assessment of the market and economic environment at a specific point in time and is not intended to be a forecast of future events, or a guarantee of future results. Forward-looking statements are subject to certain risks and uncertainties. Actual results, performance, or achievements may differ materially from those expressed or implied. Information is based on data gathered from what we believe are reliable sources.

Using diversification as part of your investment strategy neither assures nor guarantees better performance and cannot protect against loss of principal due to changing market conditions.

Past performance is not a guarantee of future results.

The opinions expressed in this commentary are those of the author and may not necessarily reflect those held by Kestra Investment Services, LLC or Kestra Advisory Services, LLC. This is for general information only and is not intended to provide specific investment advice or recommendations for any individual. It is suggested that you consult your financial professional, attorney, or tax advisor with regard to your individual situation.

Securities offered through Kestra Investment Services, LLC (Kestra IS), member FINRA/SIPC. Investment Advisory Services offered through Kestra Advisory Services, LLC (Kestra AS) an affiliate of Kestra IS. CD Wealth Management and Bluespring Wealth Partners LLC* are affiliates of Kestra IS and Kestra AS. Investor Disclosures: https://bit.ly/KF-Disclosures

*Bluespring Wealth Partners, LLC acquires and supports high quality investment adviser and wealth management companies throughout the United States.