In the news: Holiday sales predictions, air travel and inflation

With just about nine weeks until the presidential election and global pandemic developments making headlines every day, there is no shortage of news for the conscious investor to study. We are always watching out for the developments that will affect our economic outlook, and here are a few that caught our eye this week, including a change in inflation policy, tough times for nonprofits and predictions for the holiday shopping season.

+++

From Forbes: Federal Reserve Chairman Jerome Powell announced last week that the central bank would aim to maintain inflation that averages 2 percent over time. It’s a change from the Fed’s earlier policy, under which it raised rates to keep inflation from going higher than 2 percent.

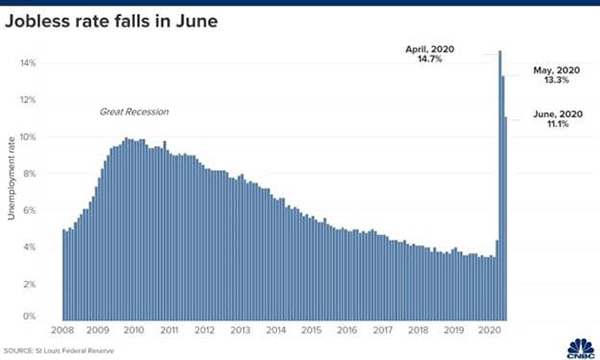
TL;DR: The COVID-19 pandemic cut inflation nearly in half, and by April of this year it had reached its lowest level in a decade. Under the Fed’s new policy, it will tolerate periods of higher inflation in order to balance out periods of lower inflation and to focus on keeping unemployment low.

+++

From CNBC: Few industries have been hit as hard by the pandemic as air travel, but new United CEO Scott Kirby says he believes his business will rebound, especially when it comes to business travel, after a vaccine is approved and distributed.

TL;DR: The Transportation Safety Administration says passenger levels are down 70 percent over last year. United, which has parked 40 percent of its fleet, could cut as many as 36,000 jobs starting in October; the airline is not planning on seeing 2019 passenger levels again until 2024.

+++

From Bloomberg: The head of the U.S. Food and Drug Administration promised that the review of a potential COVID-19 vaccine would be transparent to the public and that data alone would be behind the agency’s decision to approve and distribute it.

TL;DR: A vaccine is considered crucial to end the pandemic and revive the U.S. economy, as well as to President Trump’s re-election campaign. The agency has found itself trapped between accusations of moving too slowly, behind a political agenda, or too quickly, without sufficient data. “I would not participate in any decision that was made on anything other than science,” Commissioner Stephen Hahn said.

+++

From Inc.: Businesses that are hoping to recover from a challenging economy in 2020 by capitalizing on holiday sales would do well to understand consumer trends and opportunities based on the pandemic and its ripple effects.

TL;DR: The economy may pose challenges, but experts say consumers are likely to find a way to spend. Stores would do well to optimize their physical spaces and staffs for in-and-out shopping or curbside pickup and to cater to people who are socially distancing. Home entertainment should be a popular category, and food spending could decline this year. Also, there may be far more returns than normal, based on the rise in online shopping and the decline in shopping in person.

+++

From The Dallas Morning News: Charities across the U.S. say they are being squeezed by competing realities of COVID-19: a drop in donations that is leading to layoffs or furloughs, and economic effects that are causing their services to be more in demand.

TL;DR: Texas is particularly vulnerable to strain on nonprofits, which account for one of every eight jobs in the state. The nonprofit sector is the third-largest workforce of any U.S. industry, with more than 100,000 more workers than the nation’s manufacturers, and though billions in government aid have poured into small businesses, some say nonprofits have been an afterthought.

This material contains an assessment of the market and economic environment at a specific point in time and is not intended to be a forecast of future events, or a guarantee of future results.  Forward-looking statements are subject to certain risks and uncertainties.  Actual results, performance, or achievements may differ materially from those expressed or implied.  Information is based on data gathered from what we believe are reliable sources.

The opinions expressed in this commentary are those of the author and may not necessarily reflect those held by Kestra Investment Services, LLC or Kestra Advisory Services, LLC.  This is for general information only and is not intended to provide specific investment advice or recommendations for any individual.  It is suggested that you consult your financial professional, attorney, or tax advisor with regard to your individual situation. 

Securities offered through Kestra Investment Services, LLC (Kestra IS), member FINRA/SIPC. Investment Advisory Services offered through Kestra Advisory Services, LLC (Kestra AS) an affiliate of Kestra IS. Kestra IS and Kestra AS are not affiliated with CD Wealth Management.

Summer doldrums? Not this year

As we near Labor Day weekend, the typical summer doldrum has been anything but typical: NBA and NHL playoffs in August on TV and summer vacations in the backyard instead of the Hamptons for stock and bond traders.    

Normally, the markets plod along in August, waiting for Labor Day and the return of vacationers back to work. The summer of 2020 continues to see markets drive higher while the economy plods along, waiting for another stimulus package to help struggling small businesses.

The average S&P 500 return in August over the past 15 years has been -.17 percent. In 2020, the S&P 500 return through Aug. 25 is 5.13 percent.  Historically, volatility accompanies the meager market returns during the month of August. The chart below reflects that current one-month realized market volatility is 10.2 percent. With the current economic circumstances and global macro environment, the current level of volatility is historically mild.

S&P rolling one-month realized volatility

We are just a few months removed from volatility being at all-time highs, and as the markets have recovered, volatility has receded. The most widely known measure of implied volatility is the CBOE Volatility Index (VIX). 

The VIX is a measure of the market’s expectation of future volatility. Year-to-date volatility remains higher than normal as measured by the VIX Index, however, well off the high set on March 20. Risks remain in the economy and the market with the global pandemic, upcoming presidential election, trade tensions and geopolitical tensions. 

The market feels complacent and continues to shake off these risk factors.  Oil price and interest rate volatility have disappeared for the time being, largely in part to government intervention. The Federal Reserve stimulus programs will remain in effect through 2020, and we believe that Congress will pass an additional relief package before year’s end. Multiple vaccines are in human trials, and we continue to see additional monies flow into vaccine candidates.

So, what can we learn from all this? Accurately predicting the next market move and timing the market is extremely difficult and can adversely affect the long-term performance of your portfolio. Riding out future market volatility in addition to having a diversified portfolio means staying the course.

This material contains an assessment of the market and economic environment at a specific point in time and is not intended to be a forecast of future events, or a guarantee of future results.  Forward-looking statements are subject to certain risks and uncertainties.  Actual results, performance, or achievements may differ materially from those expressed or implied.  Information is based on data gathered from what we believe are reliable sources.

The opinions expressed in this commentary are those of the author and may not necessarily reflect those held by Kestra Investment Services, LLC or Kestra Advisory Services, LLC.  This is for general information only and is not intended to provide specific investment advice or recommendations for any individual.  It is suggested that you consult your financial professional, attorney, or tax advisor with regard to your individual situation. 

Securities offered through Kestra Investment Services, LLC (Kestra IS), member FINRA/SIPC. Investment Advisory Services offered through Kestra Advisory Services, LLC (Kestra AS) an affiliate of Kestra IS. Kestra IS and Kestra AS are not affiliated with CD Wealth Management.

Inside the growing buzz about stock splits

After Apple and Tesla announced plans recently to split their shares of stock, there has suddenly become a growing buzz that more companies will follow in their footsteps. Having seen the market response to these announcements, companies like Amazon, Google, Chipotle, Netflix, Costco and Home Depot may come under pressure to split their high-priced stocks in the near future.   

Stock splits used to be a common occurrence. If the stock price broke the $100 level to the upside, that was often a signal to the markets that the company would split the shares of stock to make it more affordable to retail investors. As seen in the chart below, stock splits reached their peak in popularity during the dot-com craze. However, today there are 63 companies in the S&P 500 whose share price is above $250 per share, nine companies trading over $750 per share and seven companies greater than $1,000 per share.

After the market collapse in 2000 and then the financial crisis in 2008, many investors were investing only in index funds and mutual funds, and companies were focused more on the institutional investors rather than individual investors. 

There appears to be a new group of younger investors that are now buying stocks. These investors care about the actual price of the share, and companies seem to be taking notice. Many brokerage platforms now offer fractional share ownership of stocks, and these younger and new investors may not be concerned about the actual valuation of the company as much as they are focused on the actual price of the stock. 

As already mentioned, there are several positives for companies splitting their shares:

* There is wider appeal to more individual investors by reducing the share price.

* Stocks don’t appear as “expensive” when the price of the share of stock is reduced.

* Help investors with portfolio composition. If a stock price isn’t as highly valued in terms of price, i.e. if you have $10,000, it may not be prudent to buy one or two shares of a stock priced at $1,000 per share.

* Doing so shows confidence in the company’s future.

What many investors are missing is the key component of stock splits: that the split itself is simply an accounting issue that brings the stock price down by increasing the number of shares outstanding up. The stock split adds no real financial value to the company.

If you own a pencil, and then break the pencil in half, your pencil is not suddenly more valuable. You still own only one pencil.

It’s the same idea with a stock split. If you own one share of stock at $1,000 per share and then split the stock in half, you now own two shares of stock at $500 per share each.  Yes, the actual price is now $500 per share and seemingly more attractive than buying at $1,000. However, from a valuation perspective, or multiple perspective as in the Price-to-Earnings multiple, that valuation has not changed at all.

So, what can we learn from all this?  At the end of the day, buying a company solely because of a planned stock split isn’t likely to be a good long-term investment strategy.

This material contains an assessment of the market and economic environment at a specific point in time and is not intended to be a forecast of future events, or a guarantee of future results.  Forward-looking statements are subject to certain risks and uncertainties.  Actual results, performance, or achievements may differ materially from those expressed or implied.  Information is based on data gathered from what we believe are reliable sources.

The opinions expressed in this commentary are those of the author and may not necessarily reflect those held by Kestra Investment Services, LLC or Kestra Advisory Services, LLC.  This is for general information only and is not intended to provide specific investment advice or recommendations for any individual.  It is suggested that you consult your financial professional, attorney, or tax advisor with regard to your individual situation. 

Securities offered through Kestra Investment Services, LLC (Kestra IS), member FINRA/SIPC. Investment Advisory Services offered through Kestra Advisory Services, LLC (Kestra AS) an affiliate of Kestra IS. Kestra IS and Kestra AS are not affiliated with CD Wealth Management.

Are tech stocks in a bubble?

The ongoing strength in large cap technology stocks has many investors wondering if there is another bubble in the making. The Nasdaq 100, as measured by the ETF, QQQ, is up 27.85 percent year to date, while the S&P 500 is up 4.75 percent for the year. 

The top 10 holdings of QQQ, which comprise almost 60 percent of the index, are all part of the so-called FAANG (Facebook, Amazon, Apple, Netflix and Google) stocks. At the same time, the top five holdings of the S&P 500, Apple, Microsoft, Amazon, Facebook and Google, make up more than 22 percent of the current index, and a big reason that the stock market returns are now positive year to date.

Investors have been willing to pay an increasingly higher price for these FAANG stocks as they continue to show massive innovation, whether through 5G, the ever-growing cloud business, or taking advantage of the stay-at-home economy caused by the pandemic.

These stocks have provided shelter from lockdown-sensitive stocks like restaurants, hotels and airlines. Cloud spending and internet streaming are proving to be mostly recession-resistant, and the at-home environment has accelerated these growth trends.

Analysts valuate these companies by looking at a myriad of financial ratios: P/E (price-to-earnings), P/B (price-to-book), P/S (Price to Sales) and PEG (price/earnings to growth), to name a few. Back in the late 1990s and early 2000s, many of the newly public growth technology companies were unprofitable and had zero revenues and earnings. These companies were far from becoming innovators and game-changers.

As seen in the chart below, at the peak of the dot-com bubble, the top 50 companies in the S&P 500 produced a P/E ratio of 40.2x, while the bottom 450 stocks had a P/E ratio of 19x. Today, the top 50 companies are trading at a P/E of 25.7x, while the bottom 450 are trading at a multiple of 20.8x. 

Fast-forward to today, the leading companies in the Nasdaq 100 are large revenue and profit generators, with a few exceptions. The price gains we have seen over the last six months in the stock market have been justified by solid earnings growth, and as a result, we have seen valuation spreads widen between these technology companies and the rest of the market. 

It is important to keep in mind that stocks trade based on future earnings and are forward-looking in nature. The earnings expectations for the top large cap companies are high, and we should expect these companies to face volatility in the near future with growing regulatory pressure, ad-spending boycotts, the upcoming election and potential corporate tax changes.

So, what can we learn from all this? The best option is to stick with a broadly diversified portfolio that can help you to achieve your own specific financial goals and not place all your eggs in one sector basket.

_____

This material contains an assessment of the market and economic environment at a specific point in time and is not intended to be a forecast of future events, or a guarantee of future results.  Forward-looking statements are subject to certain risks and uncertainties.  Actual results, performance, or achievements may differ materially from those expressed or implied.  Information is based on data gathered from what we believe are reliable sources.

The opinions expressed in this commentary are those of the author and may not necessarily reflect those held by Kestra Investment Services, LLC or Kestra Advisory Services, LLC.  This is for general information only and is not intended to provide specific investment advice or recommendations for any individual.  It is suggested that you consult your financial professional, attorney, or tax advisor with regard to your individual situation. 

Investing involves risk, including the possible loss of principal.  Past performance does not guarantee future results.  Asset allocation alone cannot eliminate the risk of fluctuating prices and uncertain returns.  There is no guarantee that a diversified portfolio will outperform a non-diversified portfolio in any given market environment.  No investment strategy, such as asset allocation, can guarantee a profit or protect against a loss.  Actual client results will vary based on investment selection, timing, and market conditions.  It is not possibly to invest directly in an index.

Securities offered through Kestra Investment Services, LLC (Kestra IS), member FINRA/SIPC. Investment Advisory Services offered through Kestra Advisory Services, LLC (Kestra AS) an affiliate of Kestra IS. Kestra IS and Kestra AS are not affiliated with CD Wealth Management.

The Headlines You Should Read This Week

With so many factors causing markets to move, we’re always on the lookout for the biggest stories, the ones that will affect our economic outlook. This week’s headlines cover Big Tech, the race to a COVID vaccine and even the return of disinfectant wipes.

+++

From Forbes: With fewer than 100 days left until the election, some investors are worried about the economic pros and cons of either candidate, but at least one expert believes Wall Street’s fixation on politics is misplaced.

TL;DR: There may be a relationship between the actions of a president and the performance of the market, but in general, the economy may have more to do with business cycles than the occupant of the White House. No matter who’s in office, investors can take comfort that in the long run, “buy and hold” worked best.

+++

From The New York Times (subscription required): Congressional hearings for the heads of Amazon, Apple, Facebook and Google promise to be a spectacle. Whether it’s more theater than substance, some say the hearings show momentum toward regulations.

TL;DR: “The C.E.O.s don’t want to be testifying. Even having this collective hearing creates a sense of quasi-guilt just because of who else has gotten called in like this — Big Pharma, Big Tobacco, Big Banks,” said Paul Gallant, a tech policy analyst at the investment firm Cowen. “That’s not a crowd they want to be associated with.”

+++

From The Wall Street Journal (subscription required): Two of the most advanced experimental coronavirus vaccines entered the pivotal phase of their studies this week, with the first subjects receiving doses of vaccines developed by Moderna and Pfizer.

TL;DR: Researchers plan to enroll 30,000 people in separate last-stage — or phase 3 — trials, the results of which will determine whether the vaccines protect against symptomatic COVID-19 and whether they should be cleared for widespread use.

Related: Think twice before speculating on a COVID-19 cure (CD Wealth Management)

+++

From CNBC: While toilet paper has mostly returned to the shelves since the panic buying of the early pandemic days in March, disinfectant wipes are still in short supply, thanks to supply chain disruptions due to competition with PPE manufacturers for the same raw materials.

TL;DR: The return of disinfectant wipes and cleaning supplies may lag behind demand well into 2021, even with companies ramping up production efforts. Manufacturers predict demand will last even beyond introduction of a COVID vaccine because of long-term shifts in consumer behavior.

+++

From NPR: It should come as no surprise that gold prices started going up as coronavirus started to spread; in uncertain times, investors tend to put their money in gold because it’s considered a “safe haven” for investors worried over instable financial markets.

TL;DR: Even though high gold prices traditionally indicate uncertainty, financial markets have generally been performing well, thanks to aggressive steps taken by the Fed. But many experts caution that market instability could be likely to continue until there is a COVID-19 vaccine, and there also are market experts who suggest that gold prices could continue to climb in the meantime.

______

This material contains an assessment of the market and economic environment at a specific point in time and is not intended to be a forecast of future events, or a guarantee of future results.  Forward-looking statements are subject to certain risks and uncertainties.  Actual results, performance, or achievements may differ materially from those expressed or implied.  Information is based on data gathered from what we believe are reliable sources.

The opinions expressed in this commentary are those of the author and may not necessarily reflect those held by Kestra Investment Services, LLC or Kestra Advisory Services, LLC.  This is for general information only and is not intended to provide specific investment advice or recommendations for any individual.  It is suggested that you consult your financial professional, attorney, or tax advisor with regard to your individual situation. 

Securities offered through Kestra Investment Services, LLC (Kestra IS), member FINRA/SIPC. Investment Advisory Services offered through Kestra Advisory Services, LLC (Kestra AS) an affiliate of Kestra IS. Kestra IS and Kestra AS are not affiliated with CD Wealth Management.

The upcoming election: It always comes back to fundamentals

We are now less than 100 days from the upcoming presidential election, and many investors are thinking about the pros and cons of which president may win the White House.  You may feel strongly about one party or the other when it comes to your politics, but when it comes to your portfolio, it doesn’t matter which party wins the White House according to historical returns. 

Fundamentals like corporate earnings, interest rates and economic growth are the main concerns for the stock market.  Jeremy Siegel, author of the book Stocks for the Long Run, says that Wall Street’s obsession with politics is mostly misplaced: 

“Bull markets and bear markets come and go, and it’s more to do with business cycles than presidents.”

Stock returns are influenced by multiple factors including business cycles, corporate profits, globalization and unpredictable events, like 9/11 or COVID-19.

The chart below is a breakdown of the “Presidential Cycle” during the first two years of a presidency compared to the end of the four-year term.  The “Presidential Cycle” shows a consistent pattern in which the first two years of a presidential term have tended to produce below-average returns while the last two years have been above average. 

The reason for this, more than likely, is that during the first two years, the president’s new agenda takes time to work its way through the economy while the last two years, the party in power is focused more on getting re-elected and see increase fiscal and monetary stimulus.  What’s interesting to note in the chart below is that whatever differences there are in the outcomes over the first two years all but disappear by the time the four-year cycle takes place. 

As shown by the light blue bars below, over four years there is little difference in stock market return between Republican and Democratic presidents.

SOURCE: Fidelity – Presidential Elections & Stock Returns

If we look at numbers alone, the short answer is that Democratic presidents have had better returns since 1929 than their Republican counterparts.  More reliable is the market’s influence on election outcomes.  When the S&P 500 has risen the 3 months before an election, the incumbent party generally has gone on to win the White House; when it has fallen, the incumbent has generally lost.

What can we learn from all this?  The best option is to stick with a broadly diversified portfolio that can help you to achieve your own specific financial goals – regardless of who prevails in November.  The economy, and therefore the market, is bigger than the direction the political winds are blowing.  Ultimately, it’s the long term fundamentals that matter.

Now more than ever, it is important to maintain an investment strategy based on your own goals, time horizon and risk tolerance.  All investing involves risk and there are no guarantees that any investment strategy, especially which biotech or pharmaceutical stock wins the COVID-19 vaccine race, will be successful.

_____

This material contains an assessment of the market and economic environment at a specific point in time and is not intended to be a forecast of future events, or a guarantee of future results.  Forward-looking statements are subject to certain risks and uncertainties.  Actual results, performance, or achievements may differ materially from those expressed or implied.  Information is based on data gathered from what we believe are reliable sources.

The opinions expressed in this commentary are those of the author and may not necessarily reflect those held by Kestra Investment Services, LLC or Kestra Advisory Services, LLC.  This is for general information only and is not intended to provide specific investment advice or recommendations for any individual.  It is suggested that you consult your financial professional, attorney, or tax advisor with regard to your individual situation.

Securities offered through Kestra Investment Services, LLC (Kestra IS), member FINRA/SIPC. Investment Advisory Services offered through Kestra Advisory Services, LLC (Kestra AS) an affiliate of Kestra IS. Kestra IS and Kestra AS are not affiliated with CD Wealth Management.

Think twice before speculating on a COVID-19 cure

As hundreds of companies around the world race to develop vaccines and drug therapies that could help end the COVID-19 pandemic, reports of successful or failed trials wildly affect individual stock prices and can trigger swings in the overall market. These stories have a knack for stirring up investors’ emotions as we all hope to move past this pandemic and return to a new “normal.”

A vaccine prepares the body’s immune system to be able to resist a specific disease and prevent it from causing sickness and spreading to others. At this point in time, there are more than 125 experimental candidates globally in the clinical evaluation stage, and another 115 candidates are in the pre-clinical stage. Clinical studies are conducted in three phases:

Phase I: A small study of healthy people tests the safety and immune response of the vaccine at different doses.

Phase II: A random, double-blind controlled study of hundreds of people further assesses safety, efficacy and optimal dosing.

Phase III: If all goes well, then thousands of people are tested in Phase III.  These larger studies are challenging as they test how well the vaccine works in an environment where the virus is spreading.

In developing a vaccine, not one of these crucial steps can be skipped, and typically a vaccine takes up to 12 to 18 months before becoming available. In this case, the government is accelerating the timeline to speed up the phases, and massive public investment has allowed drug makers to get a head start on manufacturing doses while waiting for human trials to conclude. 

Is hope on the horizon?

Needless to say, a COVID-19 vaccine is not imminent, but unprecedented levels of dollars are being spent in an effort to develop successful treatments and therapies to help COVID-19 patients. New biotechnologies, financial support and cooperation between governments and industry leaders could shave several years off typical developmental timelines.

It is rarely easy to predict which new products will perform well enough in multiple rounds of studies to earn regulatory approval. Headline-induced price swings suggest that investors are making decisions driven by hopes and fears, and possibly based on limited information, instead of a realistic assessment of long-term earnings potential. 

Investors need to be wary of banking on a particular company to emerge as the winner in the COVID-19 race just because they are the apparent leader right now. It’s impossible to know which, if any, of the experimental vaccines will be successful. Also, it’s possible that there are multiple drug makers that win regulatory approval for the vaccine.

Now more than ever, it is important to maintain an investment strategy based on your own goals, time horizon and risk tolerance.  All investing involves risk and there are no guarantees that any investment strategy, especially which biotech or pharmaceutical stock wins the COVID-19 vaccine race, will be successful.

__________

This material contains an assessment of the market and economic environment at a specific point in time and is not intended to be a forecast of future events, or a guarantee of future results.  Forward-looking statements are subject to certain risks and uncertainties.  Actual results, performance, or achievements may differ materially from those expressed or implied.  Information is based on data gathered from what we believe are reliable sources.

The opinions expressed in this commentary are those of the author and may not necessarily reflect those held by Kestra Investment Services, LLC or Kestra Advisory Services, LLC.  This is for general information only and is not intended to provide specific investment advice or recommendations for any individual.  It is suggested that you consult your financial professional, attorney, or tax advisor with regard to your individual situation. 

Securities offered through Kestra Investment Services, LLC (Kestra IS), member FINRA/SIPC. Investment Advisory Services offered through Kestra Advisory Services, LLC (Kestra AS) an affiliate of Kestra IS. Kestra IS and Kestra AS are not affiliated with CD Wealth Management.

Q3 outlook: Jobs on the rise, but so are coronavirus cases

Yesterday’s unemployment numbers were significantly above expectations, and the current unemployment rate is now at 11.1%, a decrease from the previous number of 13.3%.  A large contributor to the decline of the jobless rate was a plunge in those on temporary layoff as the economy continues to reopen and companies who have received PPP loans bringing back furloughed employees.

The market reacted positively to yesterday’s news with U.S. stocks trading higher, even as we continue to see rising numbers of new coronavirus cases. 

WHAT’S DRIVING THE MARKETS?

The overall rebound in the stock market has been driven by the aggressive fiscal and monetary stimulus packages, progress in Coronavirus treatments and containment, as well as optimism for a quick economic recovery.  The U.S. added 4.8 million jobs in June compared with expectations of 3.7 million and the unemployment rate fell for the second straight month.  Stocks rallied after testimony to Congress by Federal Reserve Chairman Jerome Powell and U.S. Treasury Secretary Steve Mnuchin, who committed to anchor the U.S. economy through the public health disaster.

WHAT ARE WE LOOKING FOR?

We are looking for continued decrease in unemployment rates in addition to monitoring the second wave of COVID-19 cases.  Currently, COVID-19 cases are on the rise in most states and the government is unable to restrain public behavior such as ensuring mask compliance. 

We expect the road ahead will be filled with uncertainty and volatility; however, Powell’s promise this past Tuesday to continue doing whatever it takes to support the U.S. economy until it gets back to where it was before the pandemic has been a relief to investors and the U.S. markets.

Despite everything that the world is facing with the global pandemic, upcoming election in November and social protests, this quarter has started in a positive direction.  The lowest number of companies on record have provided forward looking guidance for upcoming earnings.  Technology and healthcare stocks have continued to provide a strong beacon of light for this market and we do not anticipate a sector rotation at this point in time.

_____

This material contains an assessment of the market and economic environment at a specific point in time and is not intended to be a forecast of future events, or a guarantee of future results.  Forward-looking statements are subject to certain risks and uncertainties.  Actual results, performance, or achievements may differ materially from those expressed or implied.  Information is based on data gathered from what we believe are reliable sources.

The opinions expressed in this commentary are those of the author and may not necessarily reflect those held by Kestra Investment Services, LLC or Kestra Advisory Services, LLC.  This is for general information only and is not intended to provide specific investment advice or recommendations for any individual.  It is suggested that you consult your financial professional, attorney, or tax advisor with regard to your individual situation. 

Securities offered through Kestra Investment Services, LLC (Kestra IS), member FINRA/SIPC. Investment Advisory Services offered through Kestra Advisory Services, LLC (Kestra AS) an affiliate of Kestra IS. Kestra IS and Kestra AS are not affiliated with CD Wealth Management.

How can the market rebound when the economy still hasn’t?

Many of you ask us on a regular basis, “How can the market rebound so fast when the economy is still partially shut down and millions of Americans are unemployed?” There is a normal level of disconnect between the stock market and the economy, as the stock market is a leading indicator. The market will normally sell off before the economy turns south and will recover before the economy picks back up. This is never more clear than today.

As you peel back the onion on this stock market rally, look at what is driving the market higher from the March lows. You will notice that most of the sectors in the S&P 500 are still negative year-to-date, as is the overall stock market, and those that are negative, are mainly down double digits. While it should not surprise us that most sectors are in the same camp as the market, what is surprising is which sectors are in the red and which are in the black. 

It is abnormal because the sectors that usually lead the stock market out of a recession-induced downturn are not doing so now. Instead, leadership has come largely from big tech stocks and pharmaceuticals, rather than financials and cyclical sectors that closely track the ups and downs of the economy, such as industrials and consumer discretionary stocks. This time, it is very different as we have the first ever global pandemic. 

In March and May, we continued to tweak our portfolios and increase our exposure to technology and health care stocks. Throughout the entire downturn, Technology and Health Care, along with Biotech stocks, are leading the way. In the last few weeks, the cyclical sectors are starting to catch up, as you can see from the table below. It is healthy for the market to have sector rotation and not just two or three sectors leading the way, while the rest of the market struggles.

Markets continue to move higher off a rotation-driven rally as investors move into those economically sensitive value stocks. At the same time, we still have a global pandemic with many businesses shutdown, employees working from home, nationwide protests and an election coming up in November. 

We believe that technology and health care continue to be very strong sectors to own. We will continue to closely track the markets, the sector rotation and continue to tweak the portfolios as necessary.

Full Transparency

a business executive smiling and shaking hands with a room full of co-workers

Our Process

Our planning process has the rigor and comprehensiveness you would expect when trusting a firm with your financial well-being.

Learn More

two people shaking hands

Our Fees

Full transparency regarding the costs tailored to your salary, gender, and lifespan (aka your real life). We’ve got your back!

Learn More

This material contains an assessment of the market and economic environment at a specific point in time and is not intended to be a forecast of future events, or a guarantee of future results.  Forward-looking statements are subject to certain risks and uncertainties.  Actual results, performance, or achievements may differ materially from those expressed or implied.  Information is based on data gathered from what we believe are reliable sources.

S&P 500 Index is an unmanaged group of securities considered to be representative of the stock market in general. You cannot directly invest in the index.

The opinions expressed in this commentary are those of the author and may not necessarily reflect those held by Kestra Investment Services, LLC or Kestra Advisory Services, LLC.  This is for general information only and is not intended to provide specific investment advice or recommendations for any individual.  It is suggested that you consult your financial professional, attorney, or tax advisor with regard to your individual situation. 

Securities offered through Kestra Investment Services, LLC (Kestra IS), member FINRA/SIPC. Investment Advisory Services offered through Kestra Advisory Services, LLC (Kestra AS) an affiliate of Kestra IS. Kestra IS and Kestra AS are not affiliated with CD Wealth Management.

How Can Tax-Loss Harvesting Help Your Portfolio?

The last few months have definitely been challenging and interesting on many different levels from a stock market perspective.  A silver lining in the recent market volatility that many people do not often take advantage of is tax-loss harvesting.  What is tax-loss harvesting?
 
Tax-loss harvesting is where you realize losses in the portfolio with the intention of offsetting realized gains now or in the future to help reduce future tax bills.  This works through selling an investment that has underperformed and is losing money and changing to another investment that becomes a tax-winner.  Drawdowns in the market, as we saw in February and March, can provide a significant amount of loss that may be harvested. 

Many investors wait until year end to attempt tax-loss harvesting, especially in a year like 2019, where we saw very little volatility. However, this year offers an opportunity to capture losses that we haven’t seen since 2008 and 2009.

An investment loss can be used for 2 different scenarios:

1. The losses can be used to offset investment gains either today or in the future.  Short-term losses can be used to offset short-term gains, and long-term losses can be used to offset long-term gains.  The least effective use of short-term losses is to apply them to long-term gains, but may still be preferable to paying long-term capital gains tax.

2. The losses can help offset $3,000 of income on a joint tax return in one year.  Unused losses can be carried forward indefinitely.

When performing tax-loss harvesting, one has to be aware of the wash-sale rule.  The wash-sale rule states that if you sell a security, fund or ETF at a loss and buy the same or substantially identical security within 30 days after the sale, the loss will be disallowed for tax purposes.  For example, if you own IVV, iShares Core S&P 500 ETF and sell it for a loss, and then purchase SPY, SPDR S&P 500 ETF with the proceeds, the IRS will most likely deem this to be a wash sale violation and, therefore, not be able to take advantage of the realized loss. 

Tax-loss harvesting and portfolio rebalancing can provide nice synergies as they play different roles in portfolio management.  When we rebalance a portfolio, we are managing risk in the portfolio, by selling holdings that have outsized their target holdings and adding those gains to positions that may have losses or not grown as much.   Often in rebalancing, the portfolio will experience sizable capital gains.  That’s where tax-loss harvesting helps reduce the gains and bring the risk of the portfolio back to its target allocation.

We will continue to monitor the portfolios and look for opportunities to tax-loss harvest in the future, not just at year-end, but year round. 

____________

This material contains an assessment of the market and economic environment at a specific point in time and is not intended to be a forecast of future events, or a guarantee of future results.  Forward-looking statements are subject to certain risks and uncertainties.  Actual results, performance, or achievements may differ materially from those expressed or implied.  Information is based on data gathered from what we believe are reliable sources.

The opinions expressed in this commentary are those of the author and may not necessarily reflect those held by Kestra Investment Services, LLC or Kestra Advisory Services, LLC.  This is for general information only and is not intended to provide specific investment advice or recommendations for any individual.  It is suggested that you consult your financial professional, attorney, or tax advisor with regard to your individual situation. 

Neither Kestra IS nor Kestra AS provide legal or tax advice and are not Certified Public Accounting Firms.

Securities offered through Kestra Investment Services, LLC (Kestra IS), member FINRA/SIPC. Investment Advisory Services offered through Kestra Advisory Services, LLC (Kestra AS) an affiliate of Kestra IS. Kestra IS and Kestra AS are not affiliated with CD Wealth Management.