With NTX Giving Day just days away on Sept. 21, it’s a wonderful time to think about making charitable donations for both philanthropic and tax purposes! No matter what your interests are, making gifts to the causes you care about can be one of the most meaningful uses of your money. In the end, of course, what really matters is helping an organization that matters to you; the tax benefits are just icing on the cake.
Charitable giving can offer both a financial benefit for you and your family as well as the intangible rewards that come with helping others and your community. Most donations to charitable organizations come in the form of checks or credit card payments. However, there may be more efficient ways to donate that can help both the charity and your pocketbook.
It’s important to understand the benefits of different types of donations.
Cash, Check or Credit Card
This is the most simple and straightforward way of donating to charity. It is important to keep a bank record or a receipt from the charity to substantiate a cash gift. For contributions in 2023, the annual income tax deduction limits for cash gifts to public charities increased to 60% of adjusted gross income (AGI). If contributions are made in excess of those limits, the excess may be carried over for up to five years.
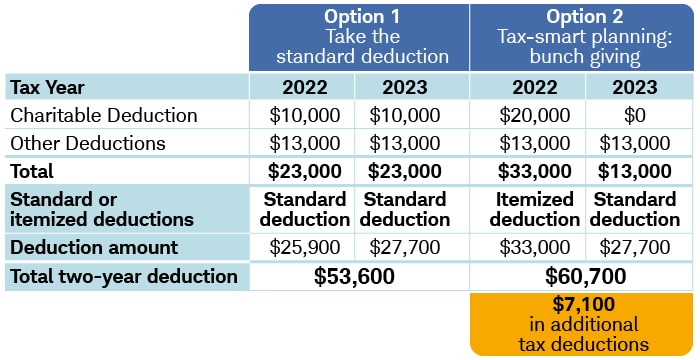
If you do not have appreciated assets to give or want to give cash, some donors may find that the total of their itemized deductions will be slightly below their standard deduction. In that case, it could be beneficial to combine or bunch several years of tax contributions into one year.
Appreciated Stock
Given the recent increases in the standard deduction, donating appreciated assets such as stock can have tremendous advantages. Gifts of stocks that have been held long enough to qualify as long-term capital gains (more than one year) can be deducted at the fair market value rather than your original purchase price. The downside is that your deduction can offset only up to 30% of your adjusted gross income (AGI).
Stocks that have not been held long enough to qualify for long-term capital gains (less than one year) receive a deduction for their cost basis, rather than fair market value. However, the deduction can offset up to 50% of AGI. Often, clients may donate the stock with the biggest winnings, which maximizes savings on capital gains, and then buy back the same stock with cash, which in turn raises the cost basis.
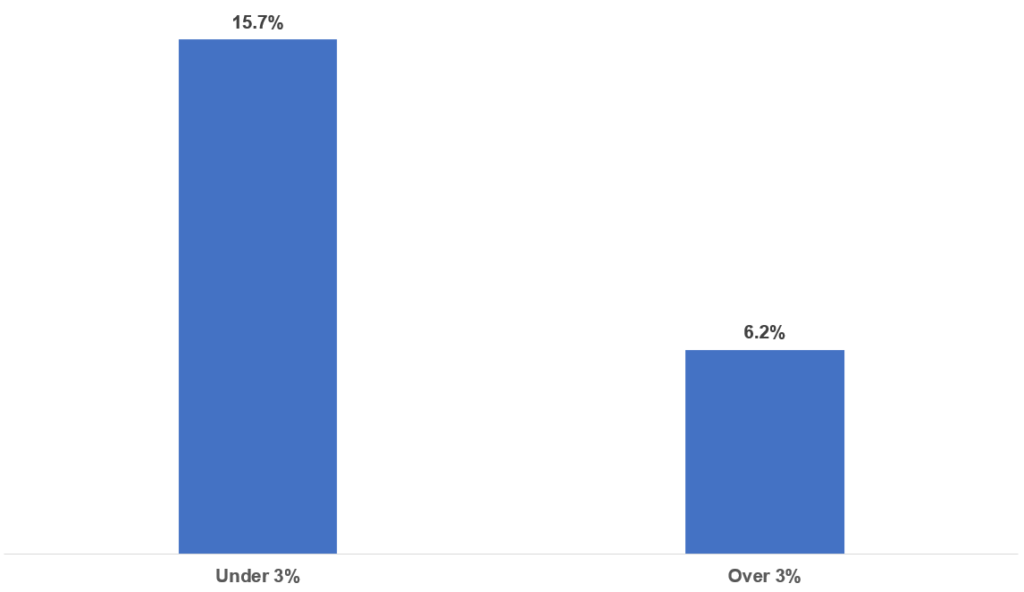
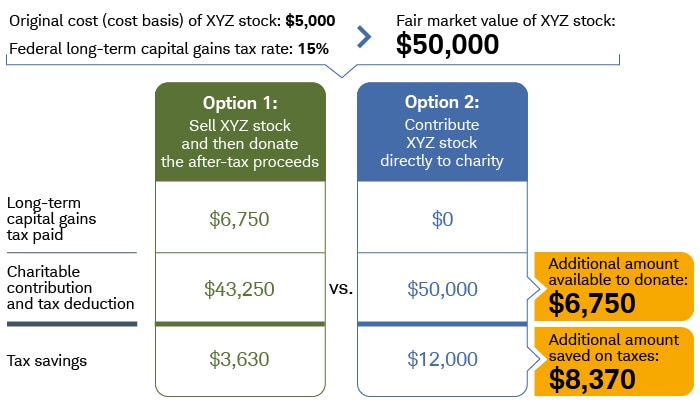
The chart below shows the difference between selling appreciated stock and then donating cash to charity compared with gifting appreciated stock. Not only would the individual save on taxes, as the charity does not pay capital gains tax, but the charity would also receive additional monies!
IRA Qualified Charitable Distributions (QCD)
This is an option only for donors over the age of 70 1/2. Qualified Charitable Distributions allow individuals to give up to $100,000 annually directly from their IRA to charitable organizations. Donor Advised Funds are excluded; the donation must go to a qualified charity.
The QCD reduces the value of the IRA and does not count towards the donor’s taxable income. It also counts towards satisfying the annual required minimum distribution. Starting in 2023, donors can also direct a one-time, $50,000 QCD to a charitable remainder trust or charitable gift annuity.
Donor Advised Fund (DAF)
Picture a Donor Advised Fund as having your own family foundation without the headache and administrative hassle of setting one up. A DAF is a charitable account established at a public charity or community foundation that allows donors to recommend grants over time.
The donor decides the timing of the donation, the charity that will receive the donation and the amount of the charitable donation made from the fund. The donor claims the tax deduction upon funding of the DAF. There is not a requirement that the DAF has to distribute 5% of the fund each year, which may allow the DAF to grow, expanding the available dollars to donate to charities. Donor advised funds also can be a charity beneficiary of IRA assets.
At CD Wealth Management, charitable giving plays a significant role in our company. We believe in giving back with our time as well as with our pocketbook.
We support many causes in North Texas and encourage our team to be involved and to give back. Each year, during the holiday season, we make charitable donations in each of our team members’ names to their charities of choice as an additional thanks and at the same time helping a great cause.
It is part of our culture, part of who we are as a firm and who we are as individuals. Please do not hesitate to reach out to us to discuss your charitable options to help you determine the best way to give for your situation.
On Thursday, Sept. 21, visit the NTX Giving Day website to join the tens of thousands of others helping charities in North Texas! (Please note: All funding options above may not be available through NTX Giving Day.)
The CD Wealth Formula
We help our clients reach and maintain financial stability by following a specific plan, catered to each client.
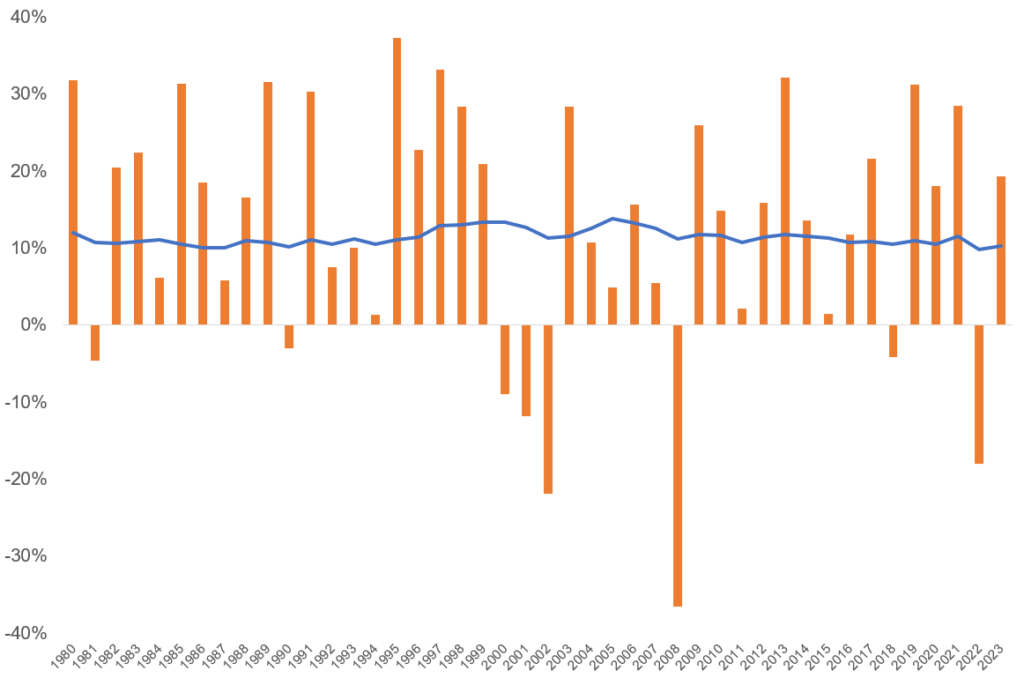
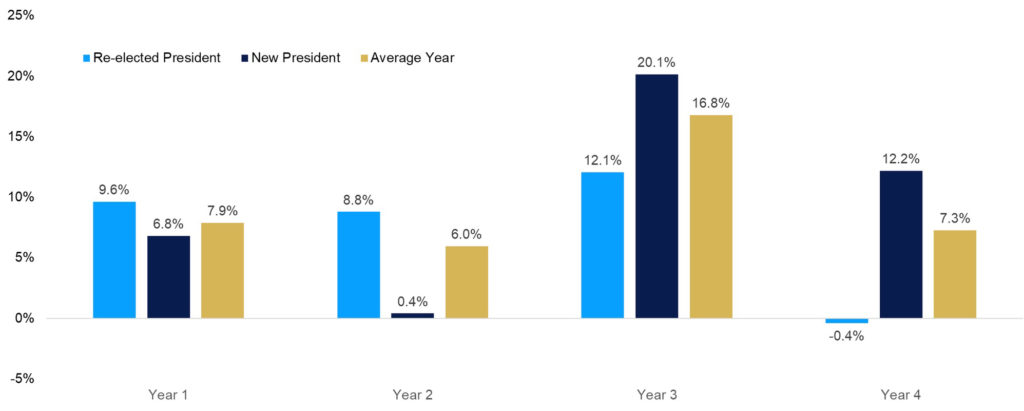
Our focus remains on long-term investing with a strategic allocation while maintaining a tactical approach. Our decisions to make changes are calculated and well thought out, looking at where we see the economy is heading. We are not guessing or market timing. We are anticipating and moving to those areas of strength in the economy — and in the stock market.
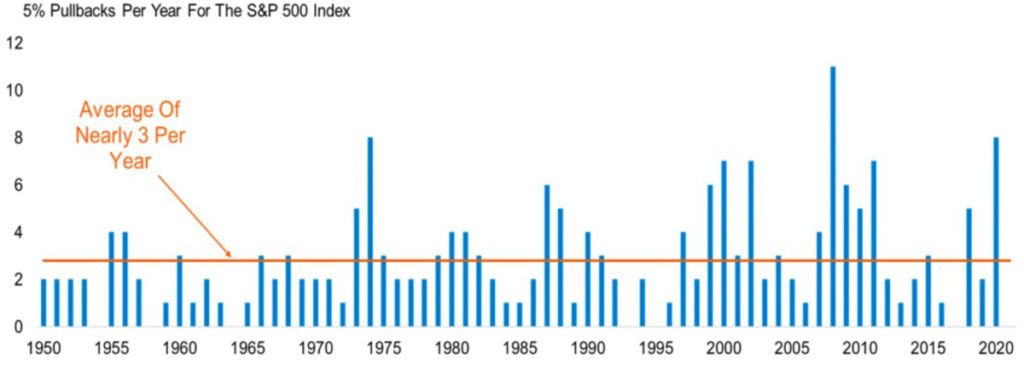
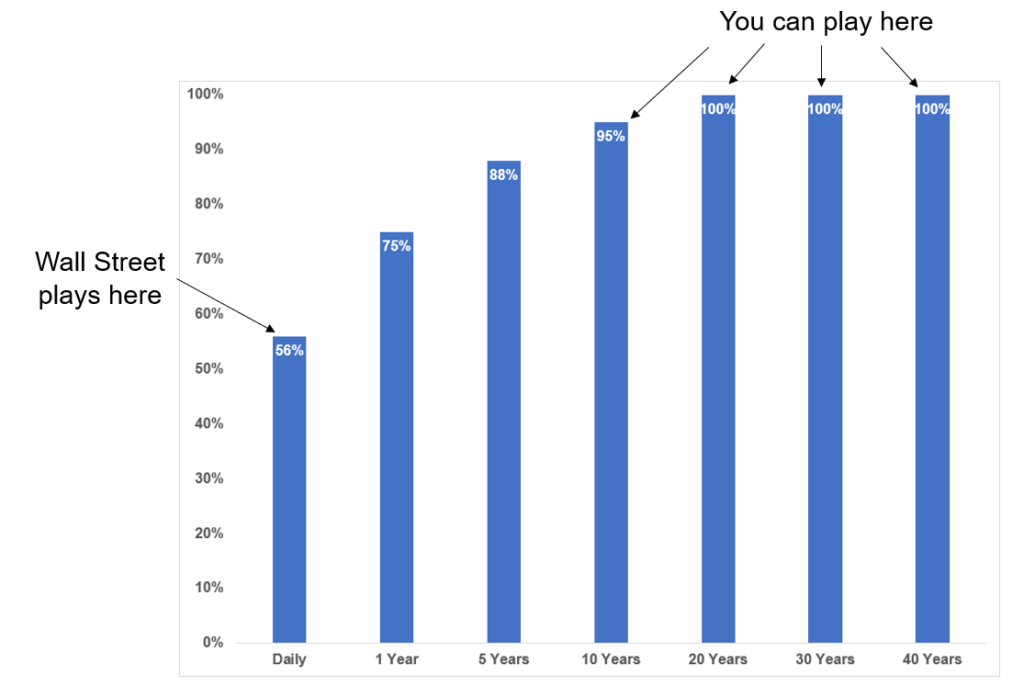
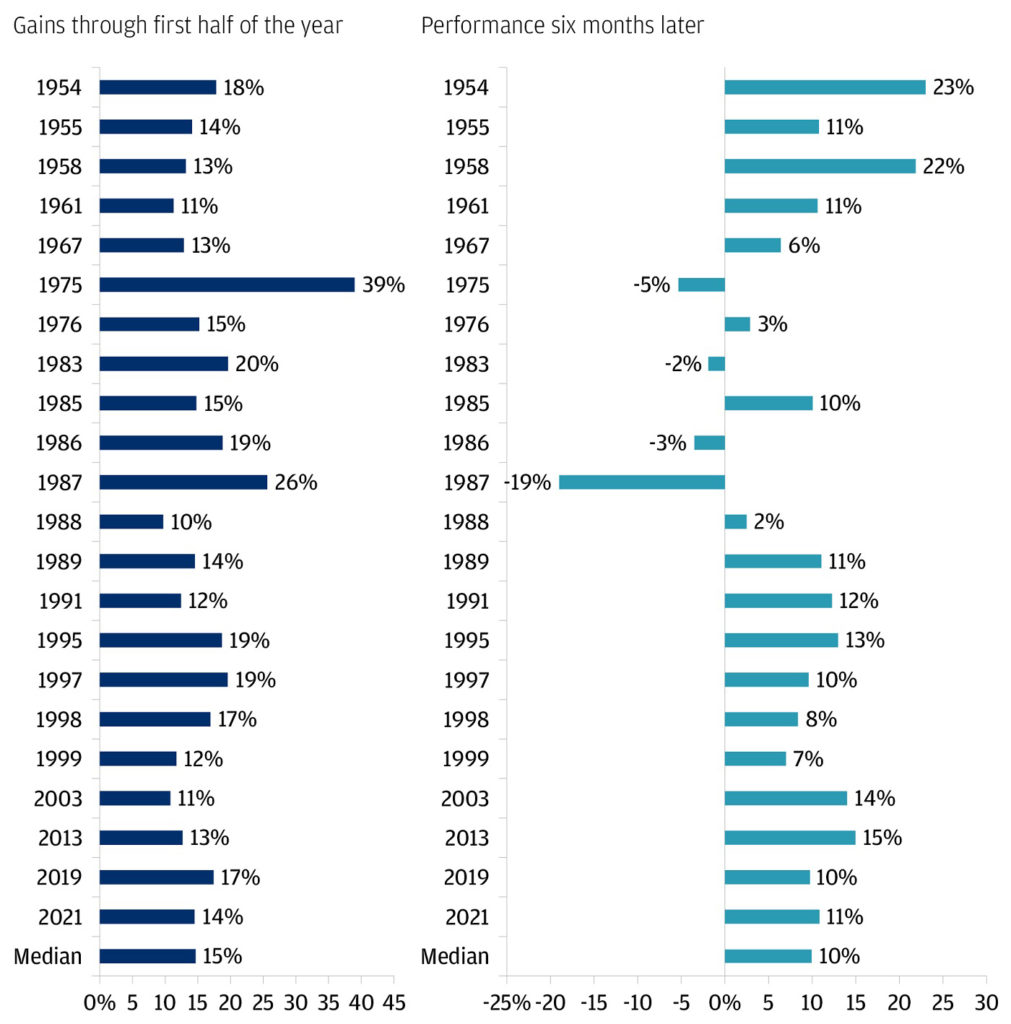
We will continue to focus on the fact that what really matters right now is time in the market, not out of the market. That means staying the course and continuing to invest, even when the markets dip, to take advantage of potential market upturns. We continue to adhere to the tried-and-true disciplines of diversification, periodic rebalancing and looking forward, while not making investment decisions based on where we have been.
It is important to focus on the long-term goal, not on one specific data point or indicator. Long-term fundamentals are what matter. In markets and moments like these, it is essential to stick to the financial plan. Investing is about following a disciplined process over time.
Source: Schwab

This material contains an assessment of the market and economic environment at a specific point in time and is not intended to be a forecast of future events, or a guarantee of future results. Forward-looking statements are subject to certain risks and uncertainties. Actual results, performance, or achievements may differ materially from those expressed or implied. Information is based on data gathered from what we believe are reliable sources.
Using diversification as part of your investment strategy neither assures nor guarantees better performance and cannot protect against loss of principal due to changing market conditions.
Past performance is not a guarantee of future results.
The opinions expressed in this commentary are those of the author and may not necessarily reflect those held by Kestra Investment Services, LLC or Kestra Advisory Services, LLC. This is for general information only and is not intended to provide specific investment advice or recommendations for any individual. It is suggested that you consult your financial professional, attorney, or tax advisor with regard to your individual situation.
Securities offered through Kestra Investment Services, LLC (Kestra IS), member FINRA/SIPC. Investment Advisory Services offered through Kestra Advisory Services, LLC (Kestra AS) an affiliate of Kestra IS. CD Wealth Management and Bluespring Wealth Partners LLC* are affiliates of Kestra IS and Kestra AS. Investor Disclosures: https://bit.ly/KF-Disclosures
*Bluespring Wealth Partners, LLC acquires and supports high quality investment adviser and wealth management companies throughout the United States.
Fidelity Investments and Fidelity Institutional® (together “Fidelity”) is an independent company, unaffiliated with Kestra Financial or CD Wealth Management. Fidelity is a service provider to both. There is no form of legal partnership, agency affiliation, or similar relationship between your financial advisor and Fidelity, nor is such a relationship created or implied by the information herein. Fidelity has not been involved with the preparation of the content supplied by CD Wealth Management and does not guarantee, or assume any responsibility for, its content. Fidelity Investments is a registered service mark of FMR LLC. Fidelity Institutional provides clearing, custody, or other brokerage services through National Financial Services LLC or Fidelity Brokerage Services LLC, Members NYSE, SIPC.