We wanted to take this occasion to look back at the content we’ve produced so far this year and share the five most widely read pieces of 2023 in case you missed any of them — or if you want to revisit and share them with friends and family.
Every week, we thoughtfully craft these pieces with our clients in mind, broaching subjects we think are relevant and interesting. This is not syndicated content. We want you to find value in these letters — especially in times like these.
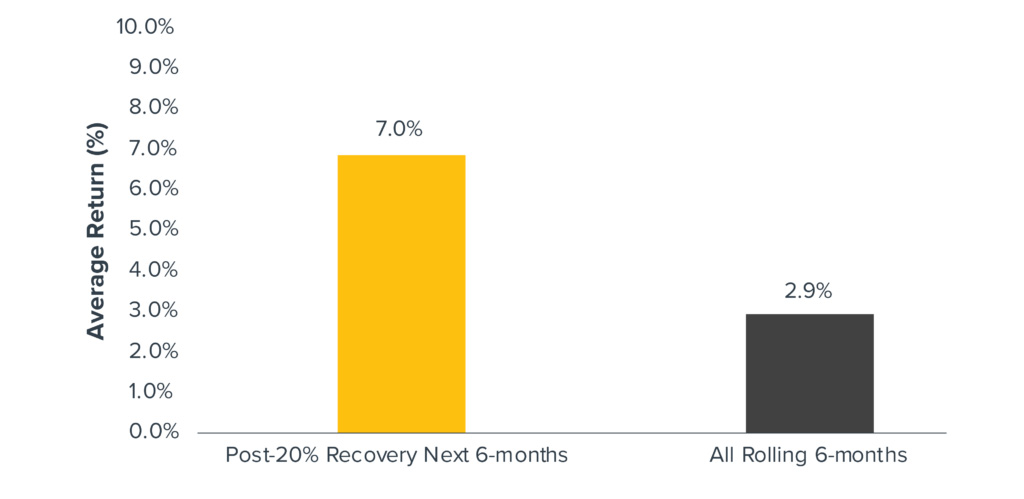
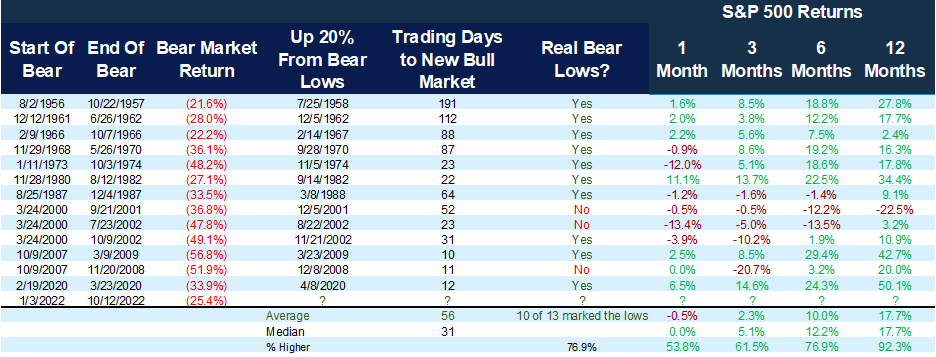
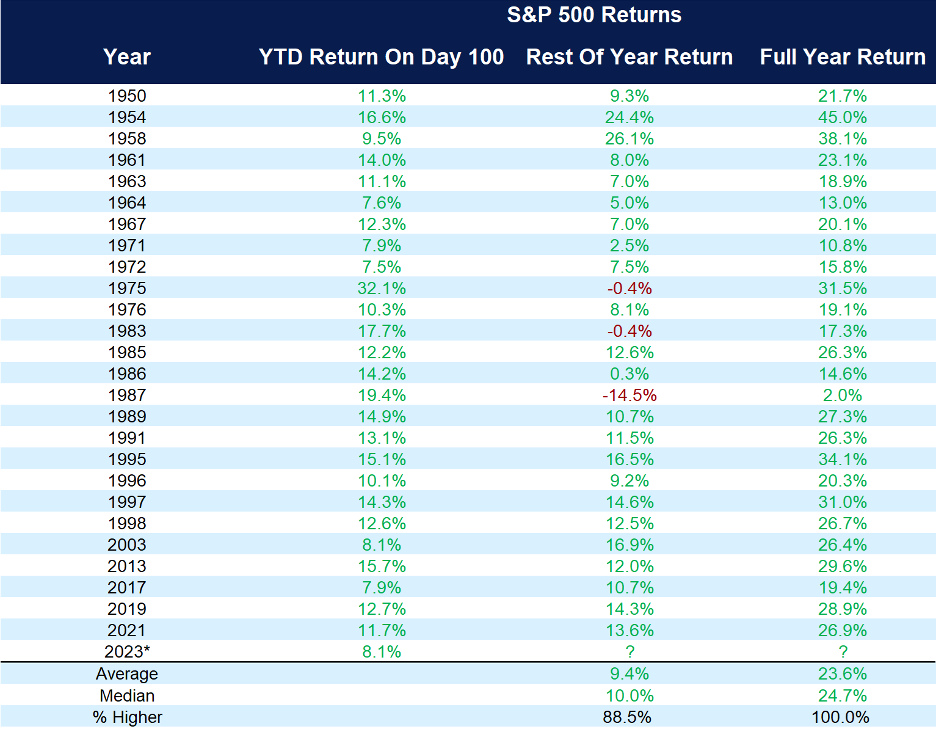
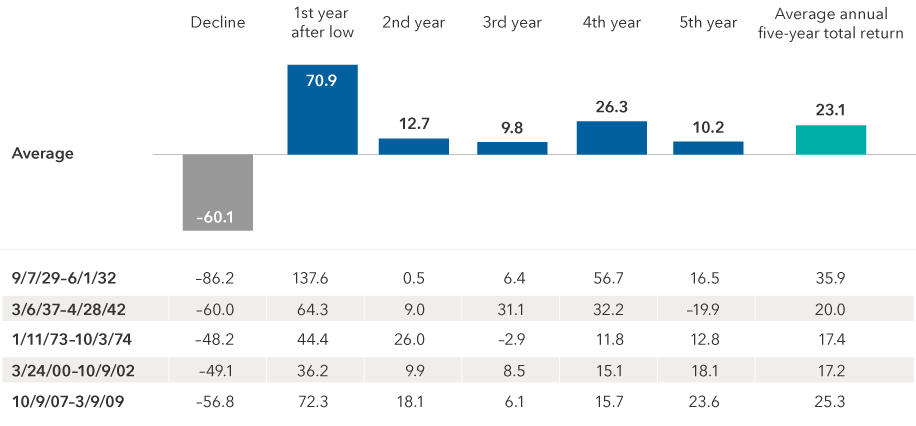
1. A New Bull Market Has Begun — Here’s What Investors Should Know
June 15, 2023 | The S&P 500 closed more than 20% higher than its October low. For now, the 2022 bear market is over.

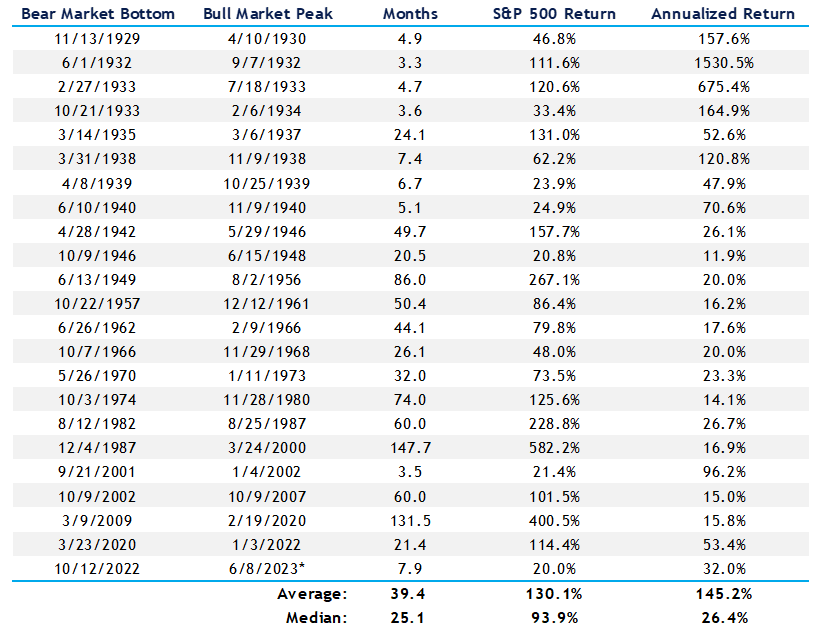
The duration of a bull market has varied significantly. Historically, bull markets have averaged 39.4 months and have produced an average gain of 130.1%. If you exclude the Great Depression, the average bull market has lasted 51 months and produced an average gain of 147%. We are now eight months into the current bull market, starting at the October low. Read more >
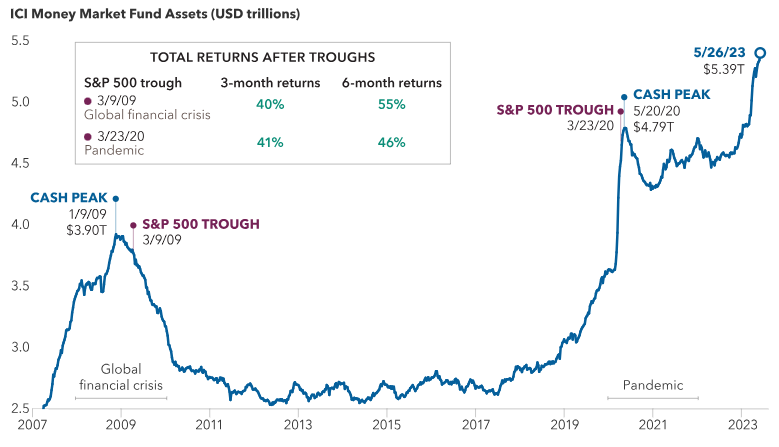
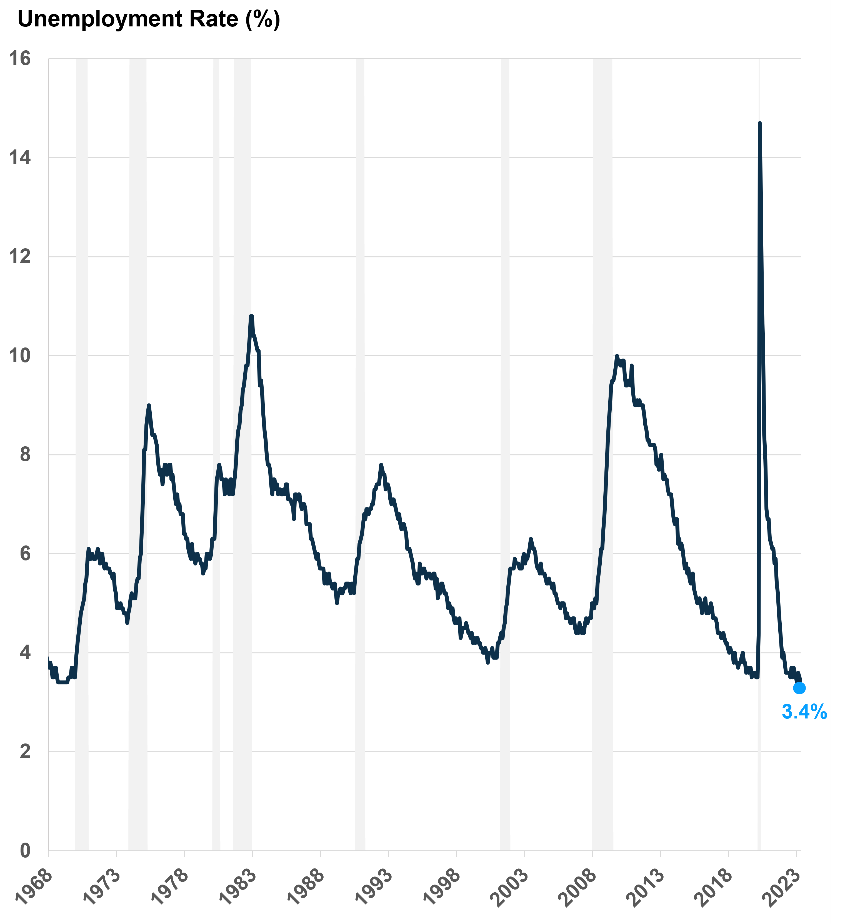
2. The Fed Raised Rates Again — Here’s What That Means for Investors
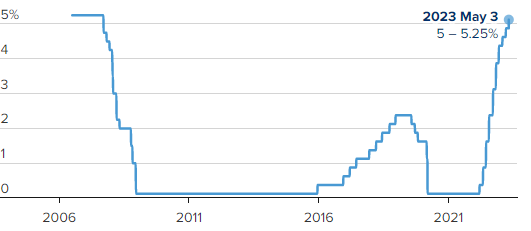
Feb. 9, 2023 | Though it appears that the Fed may be close to ending its rate-hiking cycle, additional increases still are likely.

As long as demand (GDP) and employment remain as strong as they are, the Fed will remain hesitant to cut rates and may even continue to raise them past the 5% federal fund target level. Remember, the stock market is a leading indicator, and it should lead the economy as it eventually stabilizes. Read more >
3. What Will It Take for Bonds to Bounce Back from a Historic Meltdown?
Feb. 2, 2023 | Strong yields and the prospect of a less hawkish Federal Reserve are breathing new life into bonds in 2023.

The Fed is poised to continue raising rates. However, the increase is unlikely to be as dramatic as 2022. Strong yields and the prospect of a less hawkish Federal Reserve are breathing new life into bonds. Read more >
4. An Introduction to ChatGPT, With Some Assistance From ChatGPT
April 20, 2023 | The AI tool has the potential to be transformative, with capabilities that could change how businesses allocate resources.

ChatGPT is a powerful artificial-intelligence chatbot that allows you to ask it questions using everyday language, rather than using search terms. ChatGPT responds in a conversational manner. As opposed to Siri or Alexa, these neural networks are trained on huge quantities of information from the internet of deep learning. Read more >
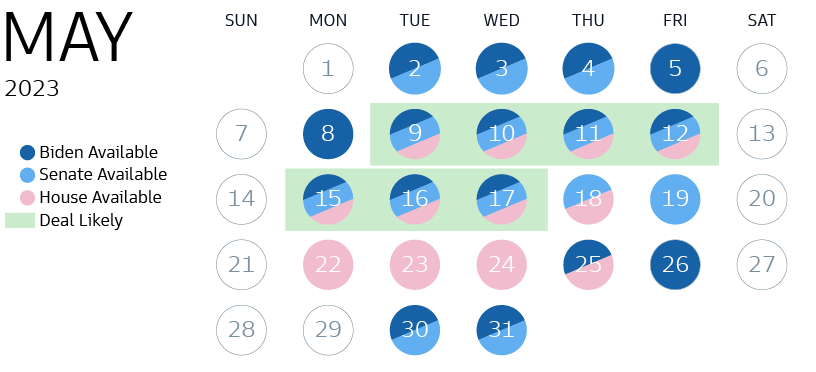
5. Here’s What Investors Need to Know About Banking Turmoil in the U.S.
March 13, 2023 | With the failure of Silicon Valley Bank and Signature Bank, the financial markets experienced a shock not seen since the Great Financial Crisis in 2008.
Could other banks have a similar fate to SVB? The short answer is yes. But remember: After both the Great Depression and the Great Financial Crisis, processes and procedures were put in place for this very reason. Read more >
The CD Wealth Formula
We help our clients reach and maintain financial stability by following a specific plan, catered to each client.
Our focus remains on long-term investing with a strategic allocation while maintaining a tactical approach. Our decisions to make changes are calculated and well thought out, looking at where we see the economy is heading. We are not guessing or market timing. We are anticipating and moving to those areas of strength in the economy — and in the stock market.
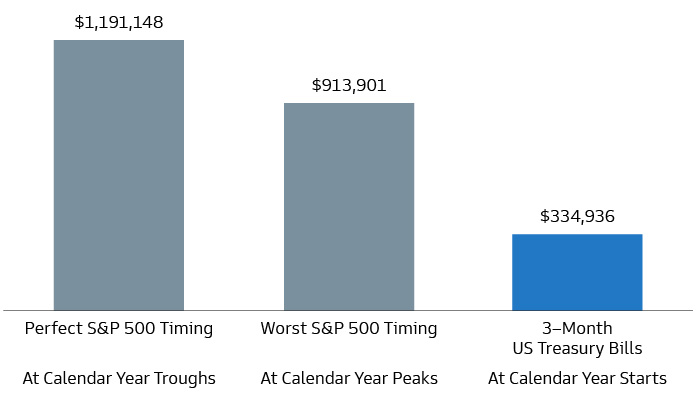
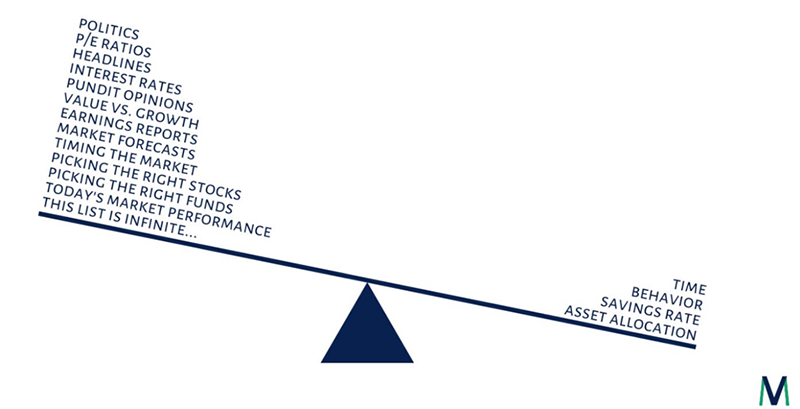
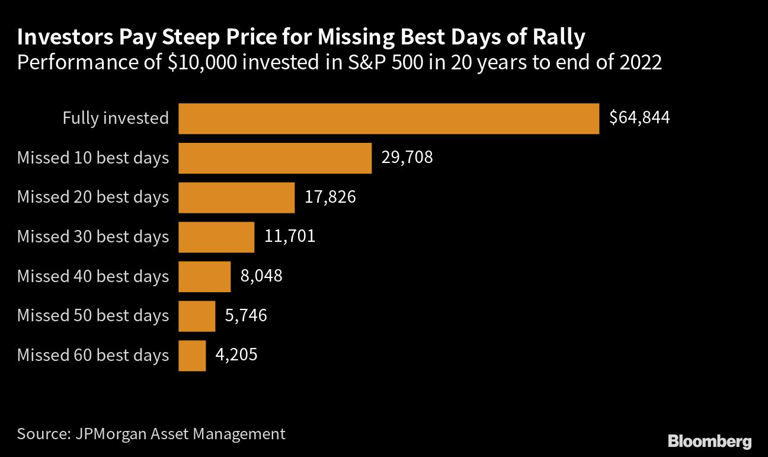
We will continue to focus on the fact that what really matters right now is time in the market, not out of the market. That means staying the course and continuing to invest, even when the markets dip, to take advantage of potential market upturns. We continue to adhere to the tried-and-true disciplines of diversification, periodic rebalancing and looking forward, while not making investment decisions based on where we have been.
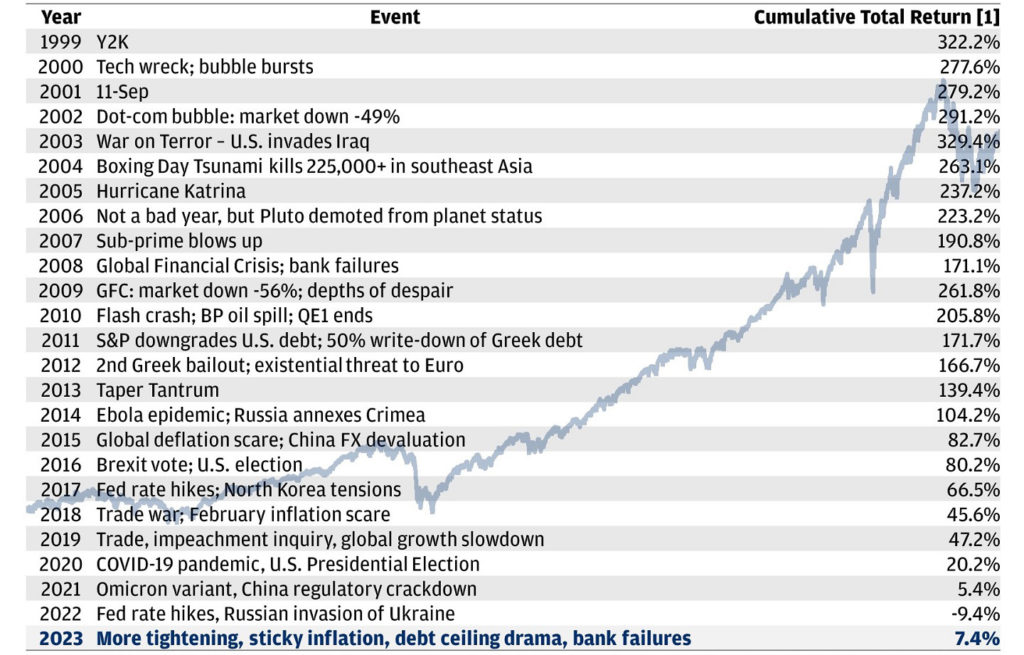
It is important to focus on the long-term goal, not on one specific data point or indicator. Long-term fundamentals are what matter. In markets and moments like these, it is essential to stick to the financial plan. Investing is about following a disciplined process over time.

This material contains an assessment of the market and economic environment at a specific point in time and is not intended to be a forecast of future events, or a guarantee of future results. Forward-looking statements are subject to certain risks and uncertainties. Actual results, performance, or achievements may differ materially from those expressed or implied. Information is based on data gathered from what we believe are reliable sources.
Using diversification as part of your investment strategy neither assures nor guarantees better performance and cannot protect against loss of principal due to changing market conditions.
Past performance is not a guarantee of future results.
The opinions expressed in this commentary are those of the author and may not necessarily reflect those held by Kestra Investment Services, LLC or Kestra Advisory Services, LLC. This is for general information only and is not intended to provide specific investment advice or recommendations for any individual. It is suggested that you consult your financial professional, attorney, or tax advisor with regard to your individual situation.
Securities offered through Kestra Investment Services, LLC (Kestra IS), member FINRA/SIPC. Investment Advisory Services offered through Kestra Advisory Services, LLC (Kestra AS) an affiliate of Kestra IS. CD Wealth Management and Bluespring Wealth Partners LLC* are affiliates of Kestra IS and Kestra AS. Investor Disclosures: https://bit.ly/KF-Disclosures
*Bluespring Wealth Partners, LLC acquires and supports high quality investment adviser and wealth management companies throughout the United States.
Fidelity Investments and Fidelity Institutional® (together “Fidelity”) is an independent company, unaffiliated with Kestra Financial or CD Wealth Management. Fidelity is a service provider to both. There is no form of legal partnership, agency affiliation, or similar relationship between your financial advisor and Fidelity, nor is such a relationship created or implied by the information herein. Fidelity has not been involved with the preparation of the content supplied by CD Wealth Management and does not guarantee, or assume any responsibility for, its content. Fidelity Investments is a registered service mark of FMR LLC. Fidelity Institutional provides clearing, custody, or other brokerage services through National Financial Services LLC or Fidelity Brokerage Services LLC, Members NYSE, SIPC.