Stocks Surged Again in 2024 — Will the Bull Market Continue?

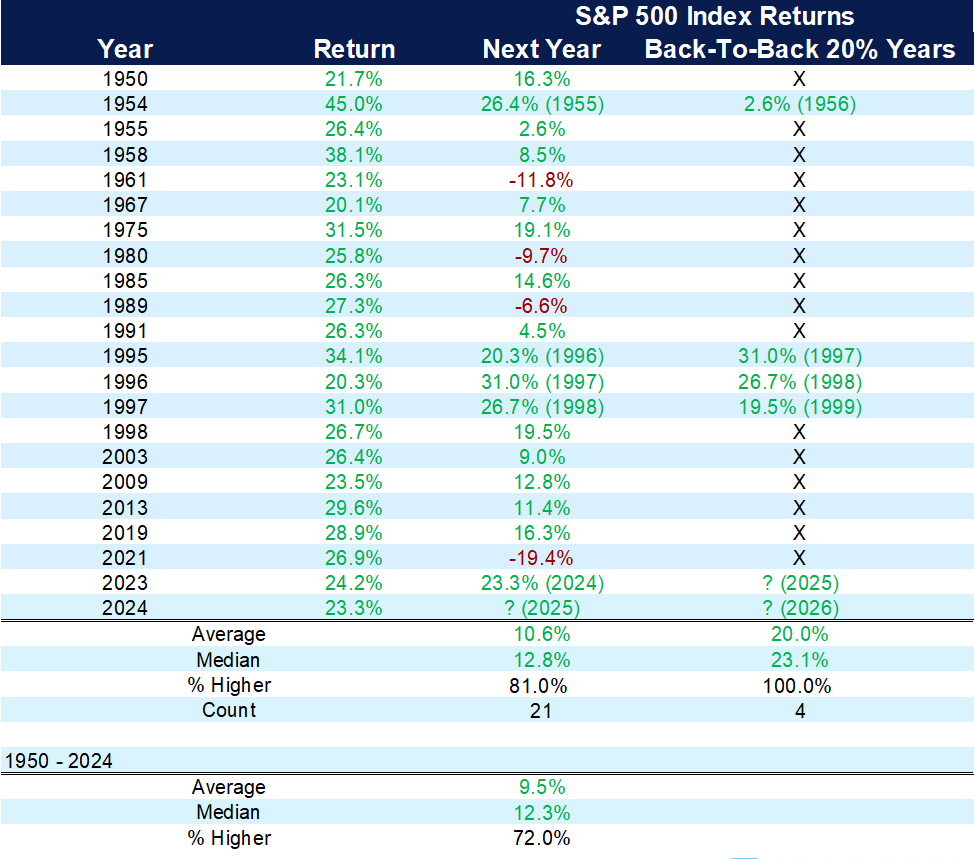
For the second year in a row, the S&P 500 gained more than 20% in 2024, marking the first time that’s occurred since the late 1990s. In each of the last four times there have been back-to-back gains of over 20% since 1950, the market has been higher — potentially a good sign for the year ahead.

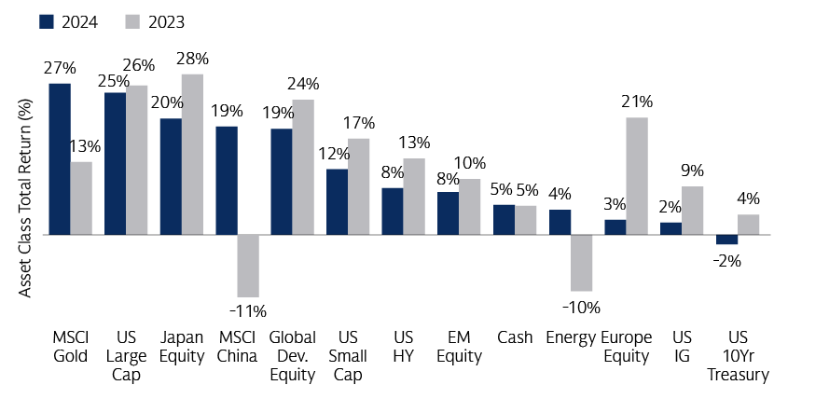
Large-growth stocks continued to lead last year, while small-cap stocks and large-value stocks lagged, gaining less than half of large-cap stocks. The Material sector in the S&P 500 was the only sector to finish negative for the year.

Returns After 20% Gains

Chart showing returns after back-to-back years with gains over 20%.
Sources: Carson Investment Research, FactSet 1/5/2025 (1950-Current)

The Magnificent Seven stocks — Apple, Amazon, Google, Meta, Microsoft, Nvidia and Tesla — returned more than 66% in 2024, boosting gains in the S&P 500 again. Magnificent Seven stocks saw a wider dispersion of returns compared to 2023. Nvidia led the way, up over 170%, and Microsoft brought up the rear, returning only 12% while being the only member to underperform the S&P 500.

The 10 largest stocks in the S&P 500 increased their weight to nearly 40% of the index. Only 19% of the stocks within the S&P 500 outperformed the index itself. The S&P 500 had a maximum drawdown during the year of 8% from its 2024 high, falling short of a 10% correction in 2024. However, both the NASDAQ and Russell 2000 fell more than 10% during the year.

2024 In Review

Chart showing stock performances by segment in 2024 and 2023.
Sources: Bloomberg, Goldman Sachs Asset Management. As of Dec. 31, 2024.

Given the narratives surrounding the election and the upcoming change in administration, the post-election aggressive market gains receded sharply to end the year. The S&P stumbled into the end of the year, with the last all-time close for the year occurring on Dec. 6.

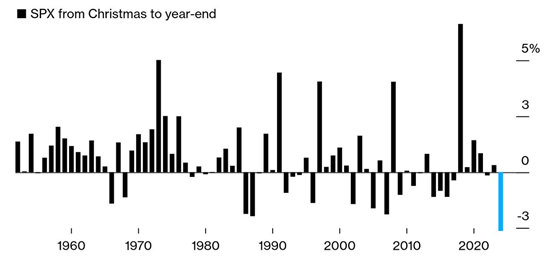
Investors were hoping for a Santa Claus Rally; since 1950, the S&P 500 has averaged a 1.3% gain during the last five trading days of the year and the first two of the new year. Unfortunately, Santa Claus did not come for the market this year; the S&P ended 2024 on a five-day losing streak, down 1.5%. Despite those results, the market had another great year!

The S&P 500’s Worst Year-End Fall Since 1952

Chart showing year-end market showings since 1952.
Source: Bespoke Investment Group

Each year, there are defining themes that dominate the markets. In 2020 it was the global pandemic, which caused the supply chain issues of 2021. In 2022, it was all about inflation. Artificial intelligence and the Magnificent Seven led the way the last two years.

Some of these themes can be positive, while others are negative. One thing that is consistent is that one theme always gives way to another — a good reminder to not chase the annual theme and stick with the investment plan. We cannot predict what theme will dominate the markets in 2025.

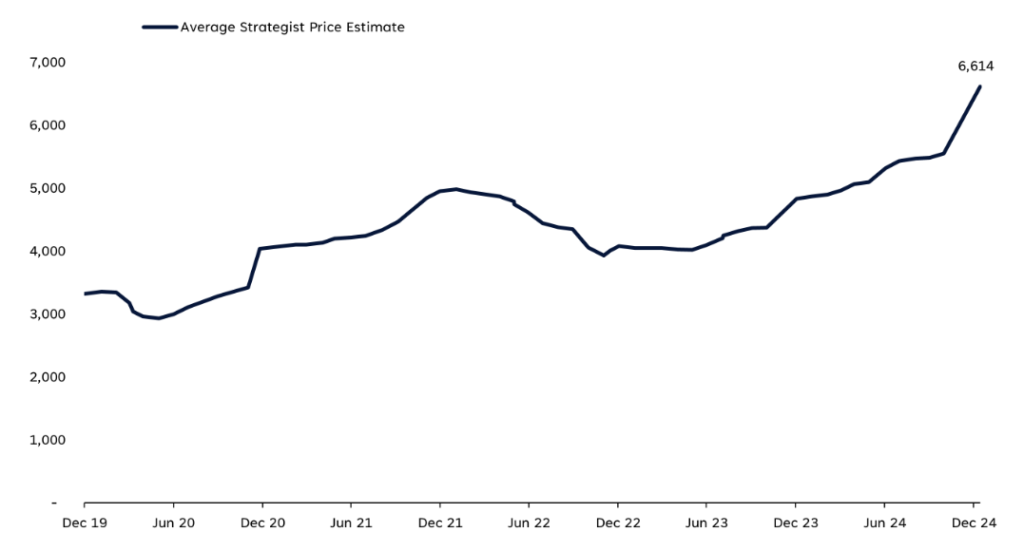
A survey of 15 Wall Street firms arrived at a predicted median S&P 500 value of 6,600 by the end of 2025, a gain of roughly 9% from recent levels. Estimates range from 6,000 to 7,100 on the S&P. Analysts have underestimated the index each year since 2019, with 2022 being the exception when the market fell more than 18%.

The 2025 aggregate forecast is the most bullish forecast since 2022, as the broad consensus is another positive year for stocks, with the bull market reaching its third anniversary during 2025. At the end of the day, though, these are predictions, and no one knows for sure how this year will play out. What we know is that over time, markets tend to rise — and staying invested is the best strategy.

Average Strategist Price Estimate

Chart showing analysts' predictions for market performance.
Sources: LPL Research, Bloomberg 12/30/24. All indexes are unmanaged and cannot be invested in directly. Past performance is no guarantee of future results. Estimates may not materialize as predicted and are subject to change.

We do see many reasons to be bullish in 2025:

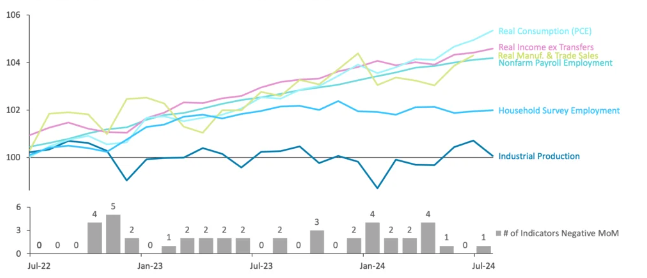
1. The economic foundation remains in good shape headed into the new year.

2. Continued advancement in artificial intelligence leads to innovation among all sectors and industries. Companies continue to spend billions of dollars on infrastructure and AI buildout for the future.

3. Earnings for companies in the S&P 500 are expected to grow by double digits again for 2025, following very strong earnings growth in 2024.

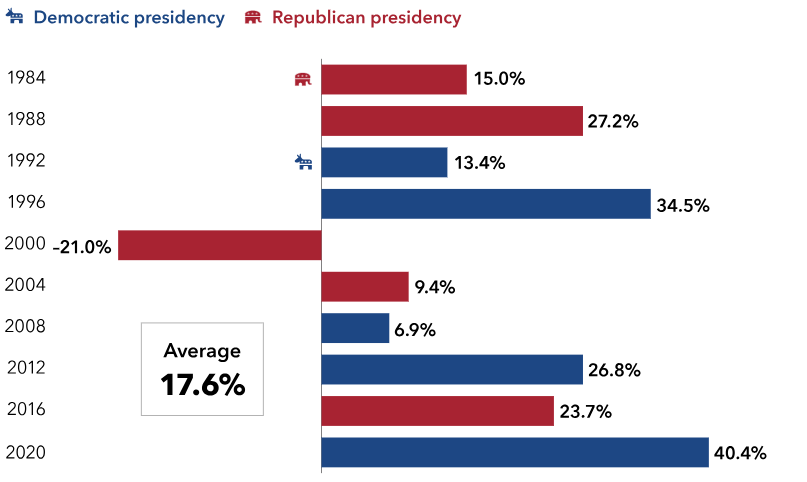
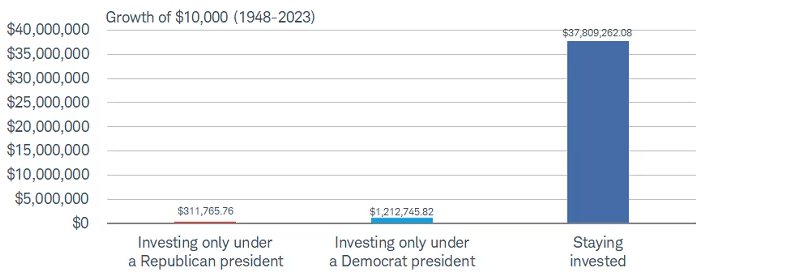
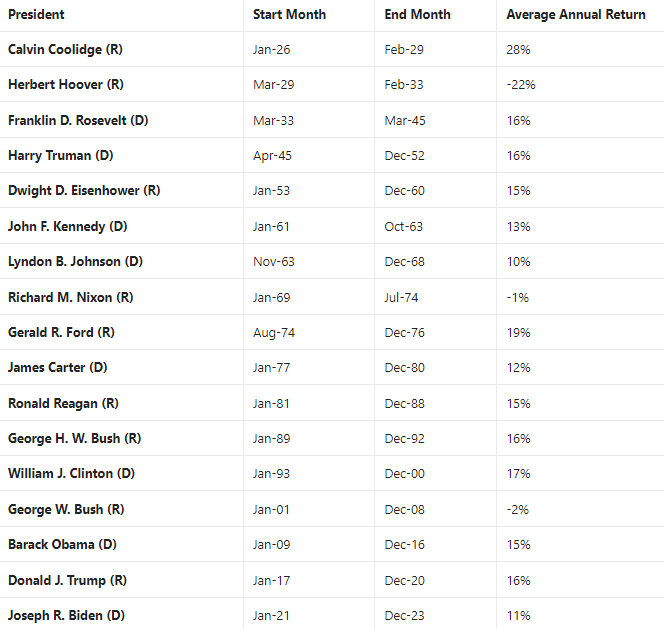
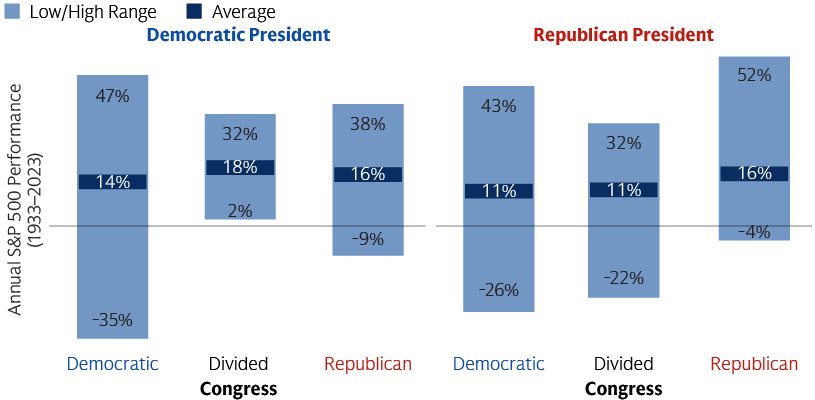
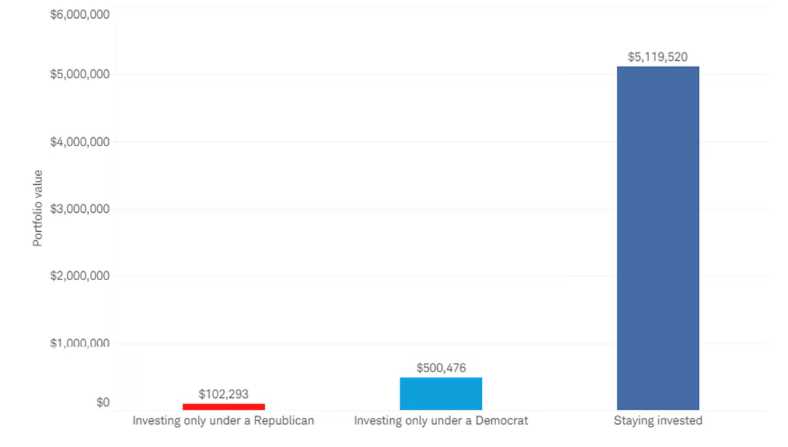
4. Don’t mix politics with investing. Markets have gone up over time, no matter who has been in the White House.

5. Trump 2.0 is expected to reduce regulation and cut taxes. Markets are expecting deregulation that in turn will help foster more merger and acquisition activity.

6. Congress is expected to tackle major tax legislation and extend the Tax Cuts and Job Act that was initially passed in 2017.

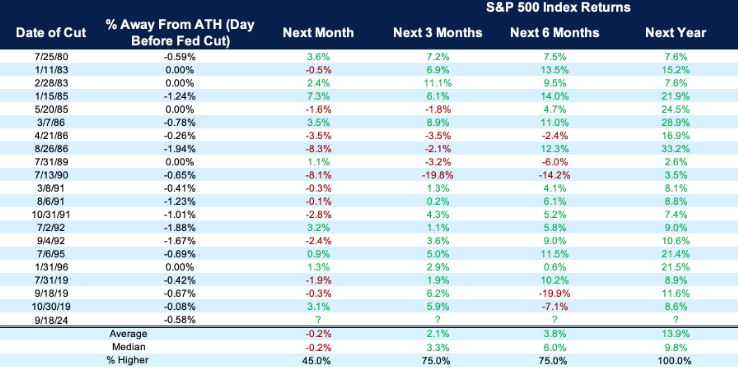
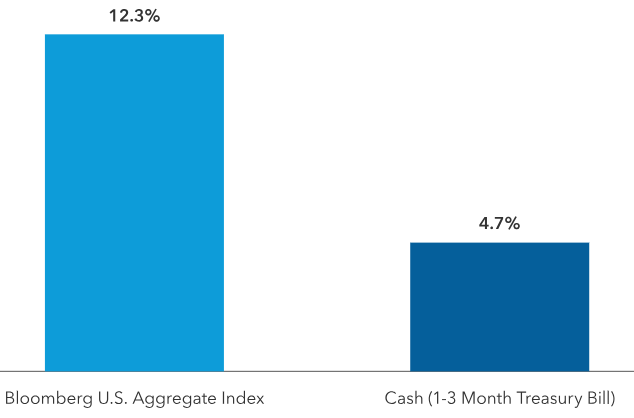
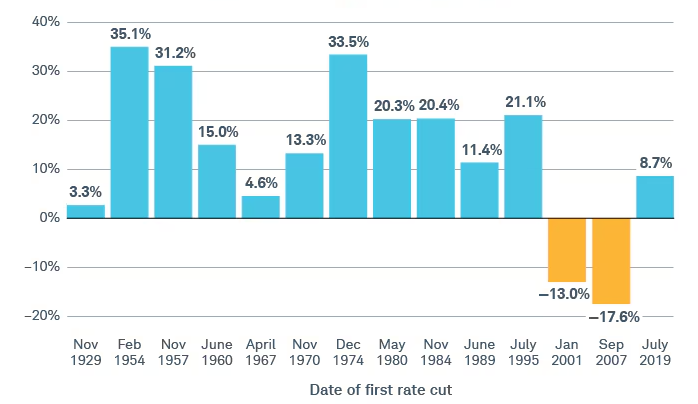
7. The Fed is expected to cut rates twice in 2025 due to higher growth of the economy and is expected to keep the bull market intact headed into its third year.

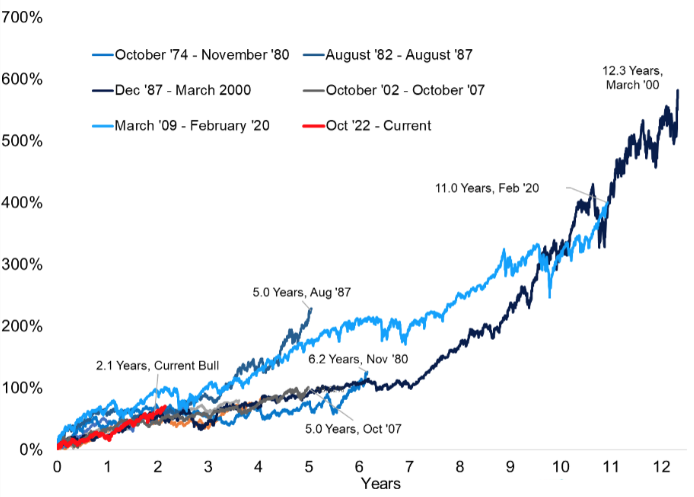
8. The bull market has advanced more than 67% in the two-plus years since it started in October 2022. History suggests that the bull market has a good chance of celebrating its third anniversary.

9. We expect more balanced growth across the U.S. economy, and we expect the U.S. economy’s continued leadership. Earnings and valuations together suggest the strong potential for a continued broadening of the market.

Promo for an article titled The Formula for Wealth is Simple, and It's Non-Negotiable.

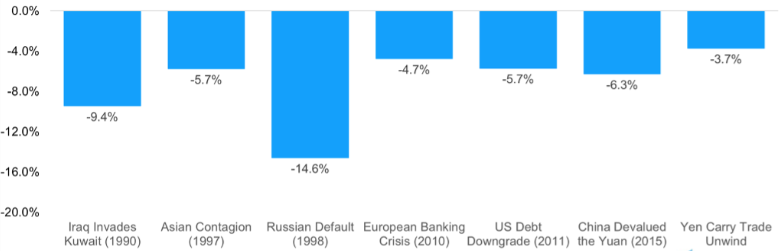
We expect market volatility to be higher in 2025, as there are more unknowns heading into the year, as well as markets that are more fully valued. Higher volatility may cause some worry. Every year there are scary headlines; ignore them.

Market pullbacks are normal, and while markets have gone up over time, they do not climb in a straight line. Since 1980, the S&P 500’s average peak-to-trough correction per year is 14.2%. In 2024, the S&P 500 did not have a correction as an index but came within 1.5% of entering correction mode.

Even strong years have market pullbacks. It is very rare that the market doesn’t have at least a 5% pullback at some point. When the inevitable pullback and correction do occur, we will continue to stay the course and be here as your guide throughout the year.

The CD Wealth Formula

We help our clients reach and maintain financial stability by following a specific plan, catered to each client. 

Our focus remains on long-term investing with a strategic allocation while maintaining a tactical approach. Our decisions to make changes are calculated and well thought out, looking at where we see the economy is heading. We are not guessing or market timing. We are anticipating and moving to those areas of strength in the economy — and in the stock market. 

We will continue to focus on the fact that what really matters right now is time in the market, not out of the market. That means staying the course and continuing to invest, even when the markets dip, to take advantage of potential market upturns. We continue to adhere to the tried-and-true disciplines of diversification, periodic rebalancing and looking forward, while not making investment decisions based on where we have been.

It is important to focus on the long-term goal, not on one specific data point or indicator. Long-term fundamentals are what matter. In markets and moments like these, it is essential to stick to the financial plan. Investing is about following a disciplined process over time.

Sources: Schwab, LPL, Bloomberg, Carson, JP Morgan, Capital Group

Revisiting the Year’s Most Valuable Insights for Our Clients

As 2024 draws to a close, we wanted to take this occasion to look back at the articles we’ve produced for our clients so far this year and share the 10 most popular pieces, in case you missed any of them — or if you want to revisit and share them with friends and family.

Every two weeks, we thoughtfully craft these pieces with our clients in mind, broaching subjects we think are relevant and interesting. This is not syndicated content. We want you to find value in these letters — especially in times like these.

1. Understanding How a Living Trust Can Help Your Estate Planning

Senior couple, documents and sign contract for life insurance or home mortgage. Discussion, signature and retired elderly man and woman signing legal paperwork for will or loan application together.

June 20: A living trust is a flexible, popular tool that allows the estate to avoid probate and lets you control asset distribution after your death. Read more

2. Another Milestone for the Dow: What Could Happen Next?

Stock market data with uptrend vector. 3d render.

May 23: The Dow’s rise to 40,000 is a reminder that when it comes to investing, patience is the key. Read more

3. Here’s Why Investors Shouldn’t Panic Over the Market’s New Year’s Hangover

Index on a screen.

Jan. 12: We talk regularly about not timing the market, and we don’t see these circumstances any differently. Read more

4. Election Advice for Investors: Ignore the Noise, Focus on the Big Picture

American Social Unrest.

Oct. 31: Presidential elections historically have had very little impact on the stock market. Read more

5. What Investors Should Know About This Week’s Market Pullback

financial stock market graph chart of stock market investment trading screen.

Aug. 8: Remember that volatility is normal and that the market does not go up in a straight line. Read more

6. The Market’s Recovery Puts August Pullback in the Rearview Mirror

Businesswoman in suit drawing stock analytics interface on virtual screen. Business and financial success concept.

Aug. 22: More often than any other month, August is when we tend to see out-of-the-blue volatility in the stock market. Read more

7. Here’s How We’re Rebalancing the Portfolio as We Enter the Second Quarter

Smiling mature couple meeting with bank manager for investment. Beautiful mid adult woman with husband listening to businessman during meeting in conference room in modern office. Happy middle aged couple meeting loan advisor to buy a new home.

March 15: We think much of the pain from rising interest rates is behind us — and the key to navigating volatility remains being in a diversified portfolio. Read more

8. Investor Outlook: A Strong May, the First 100 Trading Days and 4 Scams to Watch

Male manager businessmen are looking at the tablet screen with the company's financial information and he is tense about the performance.

June 6: S&P 500 companies are enjoying their best earnings season in almost two years. Read more

9. The Fed’s Next Move: What Could Rate Cuts Mean for Investors?

Federal Reserve Chairman Jerome Powell speaking on stage.

Sept. 5: Investors who stay only in short-term investments may risk an opportunity to lock in higher yields. Read more

10. How To Make the Biggest Impact With Your Charitable Donation

Green donate button on the keyboard close-up. blurred in motion background.

Sept. 19: Giving can offer a financial benefit for you and your family — as well as the intangible rewards that come with helping others. Read more

The CD Wealth Formula

We help our clients reach and maintain financial stability by following a specific plan, catered to each client. 

Our focus remains on long-term investing with a strategic allocation while maintaining a tactical approach. Our decisions to make changes are calculated and well thought out, looking at where we see the economy is heading. We are not guessing or market timing. We are anticipating and moving to those areas of strength in the economy — and in the stock market. 

We will continue to focus on the fact that what really matters right now is time in the market, not out of the market. That means staying the course and continuing to invest, even when the markets dip, to take advantage of potential market upturns. We continue to adhere to the tried-and-true disciplines of diversification, periodic rebalancing and looking forward, while not making investment decisions based on where we have been.

It is important to focus on the long-term goal, not on one specific data point or indicator. Long-term fundamentals are what matter. In markets and moments like these, it is essential to stick to the financial plan. Investing is about following a disciplined process over time.

The Bull Market, a Big November & 2025 Inflation Adjustments

November was a big month for stocks! The Dow closed above 45,000 for the first time, and the S&P 500 hit 6,000 for the first time. Small-cap stocks rose almost 11% during the month.

Optimism over lower taxes, a stronger economy and strong earnings were the likely reasons for the month’s great showing. So far in 2024, the S&P has made 56 new all-time highs. The S&P is up more than 25% for the year — and for the first time since 1998, it’s up more than 20% in back-to-back years.

The current bull market is 26 months old and up more than 70% from lows in mid-October 2022. The good news is that once previous bull markets get to this point, there can still be additional room to go higher. Over the past 50 years, five other bull markets have lasted more than two years. The shortest lasted five years, and the longest lasted more than 12 years.

Bull Markets Beyond Their Second Birthday

Chart showing the duration of bull markets since 1950.
Source: FactSet, Carson Investment Research 12/6/24

Here are some fun market tidbits to end the year:

1. The “Santa Claus rally” is the typically encouraging period that includes the last five trading days of December and the first two trading days of the new year.
2. December typically is the S&P 500’s second-best month in an average election year, trailing only November.
3. On average, December is the third-best month, behind April and November.
4. Going back to 1950, December has been positive 75% of the time.

Santa brings gifts — and not always in the form of market returns. The IRS recently released its inflation adjustments for 2025 related to personal income tax, retirement contributions, estate taxes and Social Security benefits. While these changes won’t affect tax returns due in April, they will be very helpful in planning for 2025.

Personal Income Tax

The standard deduction is increasing in 2025, which could mean a bigger tax break for you. The new standard deduction for 2025 is:

• Married filing jointly: $30,000, an increase of $800
• Single taxpayers and married individuals filing separately: $15,000, up $400
• Heads of Households: $22,500, an increase of $600
• In addition, retired married couples (both age 65+) filing jointly, will receive an additional standard deduction of $3,200 ($1,600 each)! This may make it more difficult to itemize deductions in 2025. We will want to keep this in mind with charitable giving to consider a bunching strategy.

For tax year 2025, the top tax rate remains 37% with income greater than $751,600 for married filing jointly ($626,350 for single taxpayers). The other tax brackets are: 

• Incomes over $501,050 for married filing jointly ($250,525 for single): 35%
• Incomes over $394,600 for married filing jointly ($197,300 for single): 32%
• Incomes over $206,700 for married filing jointly ($103,350 for single): 24%
• Incomes over $96,950 for married filing jointly ($48,475 for single): 22%
• Incomes over $23,850 for married filing jointly ($11,925 for single): 12%
• Incomes less than $23,850 for married filing jointly ($11,925 or less for single): 10% 

Retirement Savings Contributions

The 401(k)-contribution limit is increasing by another $500 to $23,500. The maximum contribution for certain profit-sharing plans is increasing to $70,000.

Traditional and Roth IRA contribution limits are staying the same at $7,000. In 2025, for those under the age of 50, the cap will remain at $7,000. Married couples with income below $236,000 will be able to make a full Roth contribution in 2025 ($150,000 for those who are single). Phaseout ranges are changed for 2025; couples with income over $246,000 will not be eligible to contribute to a Roth IRA.

While catch-up contributions for participants 50 and older will remain at $7,500, the IRS is introducing a new super catch-up contribution limit for older employees. Beginning in 2025, individuals age 60-63 can contribute an additional $3,750 to their employer-sponsored retirement plans, for a total catch-up amount of $11,250.

The backdoor Roth IRA option remains a viable choice. The first step is to contribute to a Traditional IRA; this is a non-deductible contribution. After the traditional IRA contribution is completed, you can convert those funds to a Roth IRA.

If the original contribution to a traditional IRA was not deductible, then the conversion of that amount is non-taxable. However, any growth on that amount between the contribution and the conversion dates would be taxable. Completing the backdoor Roth transaction can be a tricky process, and you will want to consult your financial advisor and CPA.

Please make sure you adjust your 401(k) plan to account for the increased contribution limit.

Social Security

Social Security benefits will increase 2.5% in 2025, an average increase of almost $48 per month. This adjustment is smaller when compared to the 5%-8% increases that were in response to higher inflation in recent years. 

Estate Taxes and Gifting

The gift tax annual exclusion is increasing from $18,000 to $19,000 for 2025, the fourth consecutive year that the gift limit has increased. Individuals can gift up to this amount to any number of individuals in 2025 without incurring gift tax or using any of the taxpayer’s lifetime exemption. Married couples can use this exemption, allowing them to gift up to $38,000 annually to each recipient in 2025.

In addition, the lifetime exemption amount increased about $380,000 per person, to $13.99 million per individual. This increase means that a married couple can shield a total of $27.98 million from federal estate or gift tax. This exemption is still set to sunset by about 50% at the beginning of 2026. Remember, however, that certain kinds of planning strategies can take months or even years to implement.

Promo for an article titled How to Make the Biggest Impact With Your Charitable Donation.

The end of the year is a perfect time to review your financial planning needs. This includes reviewing the investment portfolio, assessing year-end tax planning opportunities, reviewing retirement goals, and managing your legacy plans. The above changes for 2025 may apply to you and your family. We are happy to meet to discuss any of the above to ensure that you remain on track with your financial goals.

The CD Wealth Formula

We help our clients reach and maintain financial stability by following a specific plan, catered to each client. 

Our focus remains on long-term investing with a strategic allocation while maintaining a tactical approach. Our decisions to make changes are calculated and well thought out, looking at where we see the economy is heading. We are not guessing or market timing. We are anticipating and moving to those areas of strength in the economy — and in the stock market. 

We will continue to focus on the fact that what really matters right now is time in the market, not out of the market. That means staying the course and continuing to invest, even when the markets dip, to take advantage of potential market upturns. We continue to adhere to the tried-and-true disciplines of diversification, periodic rebalancing and looking forward, while not making investment decisions based on where we have been.

It is important to focus on the long-term goal, not on one specific data point or indicator. Long-term fundamentals are what matter. In markets and moments like these, it is essential to stick to the financial plan. Investing is about following a disciplined process over time.

Sources: Baird, Carson, Fidelity, Schwab

Year-End Suggestions to Help You Save More and Reduce Your Taxes

With the election in the rearview mirror, we are entering the home stretch for 2024. The end of the year is an important time for making financial decisions that can have an impact not only in the new year ahead, but for years to come.

As 2025 approaches, now is the perfect time to review planning strategies to ensure that your wealth plan reflects any changes in your circumstances or goals, the current tax environment and the economic landscape.

We recommend that you review the checklist below for ideas to consider and discuss.

Income Tax Strategies

1. If you anticipate your marginal income tax bracket to increase next year, you may consider accelerating income into 2024 and deferring deductions to 2025.

2. If you anticipate being in a lower tax bracket next year:

• Defer income (if possible) to postpone paying the tax and to have that income at a lower bracket.
• If you itemize on your tax return, bunch your medical expenses in the current year to meet the percentage of your adjusted gross income to claim those deductions.
• Make your January mortgage payment in December so you can deduct the interest on this year’s return.

Tax-related Investment Strategies

1. Tax-loss harvesting is the strategy of selling securities at a loss to offset a capital gain liability, either for today or in the future. Securities must be sold by Dec. 31, the last trading day of 2024, to realize a capital gain or loss.

• Harvest losses by selling taxable investments. Note: You must wait at least 31 days before buying back a holding that is sold for a loss to avoid the IRS wash-sale rule.
• Harvest gains by selling taxable investments if you have a tax loss carryforward.

2. Ensure that you have satisfied your required minimum distributions (RMD).

• If you fail to take your RMD, this may result in a 25% penalty (down from 50%). 
• If you own an inherited IRA, an RMD may be required separately for that account as well. If you inherited an IRA after 2019, the inherited IRA must be depleted by the end of the 10th year. Beginning next year, certain beneficiaries must take an annual distribution over the 10-year period following inheritance, instead of waiting to distribute the entire amount until the 10th year.

Retirement Planning Strategies

1. Maximize your IRA contributions. You may be able to deduct annual contributions of up to $7,000 to your traditional IRA and $7,000 to your spouse’s IRA ($8,000 if over the age of 50).

2. Consider increasing or maximizing your 401(k) contribution. The maximum contribution in 2024 for those under 50 is $23,000, and for those over 50, the maximum contribution is $30,500. Boosting contributions to your 401(k) can lower your adjusted gross income while increasing your retirement savings.

3. Consider making contributions to a Roth 401(k) if your plan allows.

4. Consider setting up a Roth IRA for each of your children who have earned income during the year.

Gifting Strategies

1. Consider making gifts of up to $18,000 per person as allowed under the federal annual gift tax exclusion. You can give up to $18,000 this year to as many people as you want without triggering gift taxes. Payments made directly to educational and/or medical institutions on behalf of your intended beneficiary do not count towards your annual exclusion amount — or against your lifetime estate tax exclusion.

2. Create a donor advised fund for an immediate income tax deduction and provide immediate and future benefits to charity over time.

3. If you already have a donor advised fund or want to donate to a charity, consider gifting appreciated assets that have been held longer than one year to get the fair market value income tax deduction while avoiding income tax on the appreciation.

4. If you are over the age of 70½, consider making a direct transfer from an IRA to a public charity. The distribution is excluded from gross income, and you can give up to $105,000 as a tax-free gift from your IRA that may fully satisfy RMD requirements.

5. Consider combining multiple years of charitable giving into a single year to exceed the standard deduction threshold. This is called “bunching.” The chart below illustrates how it can reduce taxes if executed properly.

Wrapping Up 2024, Planning for 2025

1. Discuss major life events with your team at CD Wealth to confirm you have clarity in your current situation.

2. Communicate with your CPA to provide capital gains and investment income information for a more accurate year-end projection.

3. Check your Health Savings Account (HSA) contributions for 2025. If you qualify, you can contribute up to $4,300 (individual) or $8,550 (family), plus an additional $1,000 catch-up if you are over 55.

4. Double-check your beneficiary designations for retirement plans, IRAs, Roth IRAs, annuities and life insurance policies.

5. If you do not already have identity theft protection, consider purchasing a service to help protect you and your family. 

The end of the year is the perfect time to review your financial planning needs.

This includes reviewing the investment portfolio, assessing year-end tax planning opportunities, reviewing retirement goals, and managing your legacy plans.

The checklist above includes just some of the items that may apply to you and your family. We are happy to meet with you to discuss any of the above and to ensure that you stay on track with your financial goals.

Promo for an article titled How to Make the Biggest Impact with your charitable donation.

The CD Wealth Formula

We help our clients reach and maintain financial stability by following a specific plan, catered to each client. 

Our focus remains on long-term investing with a strategic allocation while maintaining a tactical approach. Our decisions to make changes are calculated and well thought out, looking at where we see the economy is heading. We are not guessing or market timing. We are anticipating and moving to those areas of strength in the economy — and in the stock market. 

We will continue to focus on the fact that what really matters right now is time in the market, not out of the market. That means staying the course and continuing to invest, even when the markets dip, to take advantage of potential market upturns. We continue to adhere to the tried-and-true disciplines of diversification, periodic rebalancing and looking forward, while not making investment decisions based on where we have been.

It is important to focus on the long-term goal, not on one specific data point or indicator. Long-term fundamentals are what matter. In markets and moments like these, it is essential to stick to the financial plan. Investing is about following a disciplined process over time.

Sources: Capital Group, Fidelity, Schwab

Election Advice for Investors: Ignore the Noise, Focus on the Big Picture

We are less than a week away from Election Day. The presidential race and the race for control of the House and Senate remain very close. There is a good chance we won’t know the outcome on Election Day, and it may take many days to count the votes.

It’s possible that one candidate will gain a sizeable lead so that we will know the outcome sooner, but if not, below is a timeline for how the Presidential Election will play out over the next few months. There could be a lot of uncertainty in the days to come, and that may be reflected in a higher level of market volatility during that time.

What Happens Between Election Day and Inauguration Day

Table showing the timeline between election day and inauguration day.
Sources: Capital Group, National Archives

For long-term investors, it is important to keep in mind that the political structure in Washington hasn’t had much of an impact on market returns. From 1933 to 2023, under unified and split governments, the average annual return for the S&P 500 has been between 11% and 14%. Under a split Congress, as we have today, the market has generated an average return of 13.7%.

In more recent times, markets have posted even better results one year after Election Day. Since 1984, the average return a year later has been 17.6%, with only one year (2000) being negative. At the end of the day, financial markets appear to care more about the certainty of election outcomes than about who occupies the White House.

S&P 500 Index Total Returns One Year After Election

Chart showing market returns one year after elections since 1984.
Sources: RIMES, Standard & Poor’s. As of Sept. 30, 2024.

As the election cycle plays out, the noise and uncertainty can feel overwhelming and anxiety-provoking. In our view, long-term investors should ignore the noise and continue to focus on their financial goals and plan. Presidential elections historically have had very little impact on the stock market.

As we have continued to emphasize, stock markets are more influenced by corporate earnings, monetary policy and economic data than by the election outcome.

The balance of power in Congress may have much more of an effect on issues that matter to investors, such as tax policy, tariffs, the federal debt ceiling and foreign relations.

Consider the mythical investor who put $10,000 into the S&P 500 at the beginning of 1948 and did not care who was in the White House. If that investor kept their money in the market, that initial investment would grow to nearly $38 million! Had they invested the $10,000 with Republicans in office only, it would have grown into $310,000, and with Democrats in office only, the total would be $1.2 million.

Stay focused on the long-term goals and the bigger financial picture.

Time IN the Market Matters

Chart showing returns on a $10,000 investment under one or both parties in power.
Source: Schwab Center for Financial Research with data provided by Morningstar Inc. The above chart shows what a hypothetical portfolio value would be if an investor invested $10,000 in a portfolio that tracks the Ibbotson U.S. Large Stock Index on 1/1/1948 under three scenarios. The first two scenarios would occur if the investor only invested when one particular party was president. The third scenario is what would happen if an investor stayed invested throughout the entire period. Returns include reinvestment of dividends and interest. The example is hypothetical and provided for illustrative purposes only. It is not intended to represent a specific investment product. Indexes are unmanaged, do not incur management fees, costs and expenses and cannot be invested in directly. Past performance is no guarantee of future results.

The CD Wealth Formula

We help our clients reach and maintain financial stability by following a specific plan, catered to each client. 

Our focus remains on long-term investing with a strategic allocation while maintaining a tactical approach. Our decisions to make changes are calculated and well thought out, looking at where we see the economy is heading. We are not guessing or market timing. We are anticipating and moving to those areas of strength in the economy — and in the stock market. 

We will continue to focus on the fact that what really matters right now is time in the market, not out of the market. That means staying the course and continuing to invest, even when the markets dip, to take advantage of potential market upturns. We continue to adhere to the tried-and-true disciplines of diversification, periodic rebalancing and looking forward, while not making investment decisions based on where we have been.

It is important to focus on the long-term goal, not on one specific data point or indicator. Long-term fundamentals are what matter. In markets and moments like these, it is essential to stick to the financial plan. Investing is about following a disciplined process over time.

Sources: Capital Group, Carson, CNBC, Fidelity, Schwab

The Election May Bring Volatility, but the Market Doesn’t Care Who Wins

Stocks reached new highs again last week, the fifth week in a row that the S&P 500 has had positive returns. The S&P now has reached 46 new all-time highs this year, which ranks as the ninth-most ever — and we still have two and a half months to go.

The current bull market is 2 years old as of last Saturday, following a 25% drop in stocks in 2022 that coincided with a steep drop in bond returns as well. Since 1950, the average bull market has lasted more than 5 years and has gained more than 180%. Based on history, we know the market does not go up in a straight line, and plenty of upside remains.

The Bull Market Is Still Young

S&P 500 bull markets from 1950 to today

Sources: Carson Investment Research, YCharts 10/7/24. *Most recent new all-time high was on 9/30/24. 


For now, political uncertainty appears to be doing little to dampen enthusiasm for stocks. Strong economic growth has helped the S&P 500 reach its new highs; it is up over 20% for the year and is on track for the second straight year of double-digit gains.

Still, election anxiety may be on investors’ minds. The VIX, which measures market volatility, has risen about 25% since late September. Some of the increase is attributable to the election and concern that we may not know the outcome immediately following Election Day. Markets do not like uncertainty.

Every four years, investors may worry about what to do with their portfolio as the election nears. History shows that over the long term, the stock market tends to be relatively indifferent to who is in office.

Since 1926, the market has seen negative returns only three times in 17 presidential administrations. One came during the Great Depression under Herbert Hoover, and another came during the Great Recession under George W. Bush. During Richard Nixon’s time in office, the U.S. suffered through the Vietnam War and two recessions — and suffered average losses of only 1% per year.

Chart showing average returns during last 17 presidencies.


Politics can bring out strong emotions and biases, but as we have said before, investors would be wise to tune out the noise and focus on the long-term fundamentals. Political opinions are best expressed at the polls, not through your portfolio. Historically speaking, election results have made almost no difference when it comes to long-term investment returns.

History also shows that stocks have done well regardless of which party is in control in Washington. Since 1933, there have been eight Democratic presidents and seven Republican presidents. The chart below shows how the market has performed on average under each scenario for the party in control of the White House and Congress. In that time, the worst average annual return was 11% — to the positive.

Chart showing market returns in different party scenarios.


Investors who allow political opinions to harm their investing discipline have missed out on above-average returns during presidents they don’t like.

The chart below shows that if you invested $10,000 in 1961, it would have grown to more than $102,000 by 2023 if you invested only during a Republican presidency. If you invested the same $10,000 in 1961, that same investment would have grown to $500,000 if you invested only while a Democrat was in the White House. However, that $10,000 investment would be worth more than $5.1 million if you just stayed invested no matter who was in office.

Growth of $10,000 (1961-2023)

Chart showing how a $10,000 investment would have fared aince 1961 depending on behavior in regard to who is in office.
Sources: Schwab Center for Financial Research with data provided by Morningstar, Inc. The above chart shows what a hypothetical portfolio value would be if an investor invested $10,000 in a portfolio that tracks the Ibbotson U.S. Large Stock Index on Jan. 1, 1961, through the end of 2023 under three different scenarios. The first two scenarios are what would occur if an investor only invested when one particular party was president. The third scenario is what would occur if an investor had stayed invested through the entire period. The example is hypothetical and provided for illustrative purposes only. It is not intended to represent a specific investment product. Dividends and interest are assumed to have been reinvested, and the example does not reflect the effects of expenses, taxes or fees, and if it had, performance would have been substantially lower. Indexes are unmanaged, do not incur management fees, costs and expenses, and cannot be invested in directly. For additional information, see schwab.com/indexdefinitions. Past performance is no guarantee of future results.


Investors should not let their political opinions or emotions dictate their decisions. The markets really don’t care about the results or the daily micro-dramas in the presidential race. Markets are much more likely to be influenced by corporate earnings, economic data and monetary policy.

As James Carville said back in 1992, “It’s the economy, stupid.”

Unemployment remains near historic lows. Inflation has dropped from a post-pandemic high of 9% to 2.4%. The stock market is at new highs, and interest rates and energy prices are on the decline. Long-term investment strategies tend to perform well regardless of who occupies the White House.

Promo for an article titled What Investors Should Know About the Fed’s First Rate Cut Since 2020.

The CD Wealth Formula

We help our clients reach and maintain financial stability by following a specific plan, catered to each client. 

Our focus remains on long-term investing with a strategic allocation while maintaining a tactical approach. Our decisions to make changes are calculated and well thought out, looking at where we see the economy is heading. We are not guessing or market timing. We are anticipating and moving to those areas of strength in the economy — and in the stock market. 

Our focus remains on long-term investing with a strategic allocation while maintaining a tactical approach. Our decisions to make changes are calculated and well thought out, looking at where we see the economy is heading. We are not guessing or market timing. We are anticipating and moving to those areas of strength in the economy — and in the stock market. 

It is important to focus on the long-term goal, not on one specific data point or indicator. Long-term fundamentals are what matter. In markets and moments like these, it is essential to stick to the financial plan. Investing is about following a disciplined process over time.

Sources: BlackRock, Capital Group, Carson, CNBC, Dimensional Funds, Fidelity, Schwab

What Investors Should Know About the Fed’s First Rate Cut Since 2020

After another rough start to the month of September, stocks have rallied and have remained positive for the last three weeks. The S&P 500 has been up 10 out of the last 11 months, and all three major U.S. stock market indexes are near all-time highs.

The big story last month was the Fed’s decision to cut interest rates for the first time since March 2020, when Covid-19 shuttered most of the world’s economy. The Fed reduced interest rates by 50 basis points on Sept. 18. Although it was widely expected that the Fed would cut rates, questions remained about the size and timing.

Did the Fed’s decision have anything to do with the election?

The Fed made the cut in its final meeting before the election in November; its next meeting will be Nov. 7, two days after the election. The Fed has consistently and repeatedly stressed that political considerations do not factor into its decision-making, regardless of what some media reports may say.

“We never use our tools to support or oppose a political party, a politician, or any political outcome,” Chairman Jerome Powell said at the Fed’s July press conference. “Anything that we do before, during or after the election will be based on the data, the outlook, and the balance of risks, and not on anything else.”

The Fed has shifted its focus from the fight against inflation to the health of the job market. For much of the past few years, unemployment has been so low and inflation so high that the Fed could focus predominantly on reigning in inflation. Now, unemployment has risen above to 4.2% from a low of 3.4%, and the pace of new jobs being added each month has slowed.

Are rate cuts near all-time market highs normal?

This is not the first time that the Fed has cut rates with the market at or near all-time highs. In fact, this most recently occurred in 2019. There have been 20 times that the Fed cut rates when the market was within 2% of all-time highs, and in each instance, stocks were higher a year later. Remember the adage: Don’t fight the Fed!

Fed Cuts Near All-Time Highs

S&P 500 returns after Fed cuts within 2% of an all-time high

Chart showing S&P 500 returns after Fed cuts within 2% of an all-time high.
Sources: Carson Investment Research, FactSet 9/18/24

Does this mean that the Fed thinks the economy is in trouble?

The economy continues to surprise to the upside. While the labor market has been cooling, it is important to remember that it is coming down from unusually high levels from the global pandemic. GDP growth for the last five years was revised from 9.4% to 10.7% and grew at 3% for the last quarter. Disposable income for households also was revised higher and as a result, the savings rate was revised up from 3.3% to 5.2% in the previous quarter.

Corporate earnings are expected to grow at double digits for the year and are expected to grow 15% for 2025. Looking at the chart below, only one of the six indicators used by the National Bureau of Economic Research for recession tracking reflects a potential recession.

Recessionary Indicators

National Bureau of Economic Research recession indicators for the United States (normalized to July 2022)

Chart showing National Bureau of Economic Research recession indicators for the United States (normalized to July 2022).
Sources: Bureau of Labor Statistics, Bureau of Economic Analysis, Federal Reserve, U.S. Census Bureau, iCapital Investment Strategy with data based on availability as of Sept. 4, 2024. Note: Data as of July 2024 for all indicators except for Real Manufacturing & Trade Sales, which is as of June 2024. Data is subject to change based on potential updates to source database. Analysis looks at the six indicators used by the NBER to define a recession in the United States. For illustrative purposes only. Past performance is not indicative of future results. Future results are not guaranteed.

What do rate cuts mean for consumers and investors?

It is important to remember that the Fed controls very short-term rates only. The Fed does not set interest rates for mortgages, CDs, or bonds. However, it can influence these rates through its actions. Consumers may feel the impact most immediately with lower interest payments on debt that is tied to the prime rate, like credit cards or auto loans.

Interest rates on longer-term debt, like mortgages, have already been falling in anticipation of lower rates coming. It is important to note that mortgage rates won’t keep pace with Fed rate cuts, and the days of 3% mortgages are a long way off — if they ever come again.

Investors have been anxious for the Fed to begin cutting rates. There have been 13 rate-cut cycles since World War II, with an average S&P 500 return after the first rate cut of 14%. It is not just stocks that stand to benefit from lower rates. As the Fed lowers rates, cash yields will drop in tandem. Investors faced with lower rates on cash have been moving into stocks and bonds to replace the lost yield.

Historically, bonds have been at their strongest in periods of rate cuts since bond prices rise as yields fall. Average returns for the U.S. Aggregate Bond Index have outpaced cash proxies in rate-cutting periods over the last 40 years.

Falling Rates Have Supported Bond Returns

Average annualized monthly returns during rate-cutting cycles

Chart showing how Falling Rates Have Supported Bond Returns.
Sources: Capital Group, Bloomberg. Based on average monthly returns during rate-cutting periods from September 1984 through Sept. 11, 2024.

Where do we go from here?

The market is pricing in that by this time next year, the Fed will have cut interest rates eight to 10 times, and the benchmark rate will be at 3%. That would be much lower than today’s rates but still higher than any time from 2009 to 2021. 

October typically has been the worst month during an election year, and we wouldn’t be surprised to see some volatility during the month. However, the good news is that November and December do quite well in election years as the uncertainty of the election is removed. Investors have been rewarded for staying invested amid the constant negative sentiment and worry.

The CD Wealth Formula

We help our clients reach and maintain financial stability by following a specific plan, catered to each client. 

Our focus remains on long-term investing with a strategic allocation while maintaining a tactical approach. Our decisions to make changes are calculated and well thought out, looking at where we see the economy is heading. We are not guessing or market timing; we are anticipating and moving to those areas of strength in the economy — and in the stock market. 

We will continue to focus on the fact that what really matters right now is time in the market, not out of the market. That means staying the course and continuing to invest, even when the markets dip, to take advantage of potential market upturns. We continue to adhere to the tried-and-true disciplines of diversification, periodic rebalancing and looking forward, while not making investment decisions based on where we have been.

It is important to focus on the long-term goal, not on one specific data point or indicator. Long-term fundamentals are what matter. In markets and moments like these, it is essential to stick to the financial plan. Investing is about following a disciplined process over time.

Sources: Capital Group, Carson, Fidelity, NBER

How To Make the Biggest Impact With Your Charitable Donation

Today is North Texas Giving Day, an important occasion in our community — and an annual reminder to think about making charitable donations for both philanthropic and tax purposes! No matter what your interests are, making gifts to causes you care about can be one of the most meaningful uses of your money. 

In the end, what really matters is helping an organization that matters to you. The tax benefits from a donation are just icing on the cake.

Charitable giving can offer a financial benefit for you and your family as well as the intangible rewards that come with helping others. Most donations to charitable organizations come in the form of checks or credit card payments. However, there may be more efficient ways to donate, which in turn can help both the charity and your pocketbook.

Understanding the benefits for different types of donations is important.

Cash, Check or Credit Card

These are the most simple and straightforward ways to donate to charity. It is important for you to keep a receipt from the charity or a bank record to substantiate cash gifts.

For contributions made in 2024, the annual income tax deduction limit for cash gifts to public charities is 60% of adjusted gross income (AGI). If you make contributions in excess of those limits, you can carry over the excess for up to five years until it is all used, but not beyond that time.

If you do not have appreciated assets to give or if you want to give cash, you may find that the total of your itemized deductions will be slightly below the standard deduction. In that case, it could be beneficial to combine or bunch several years of tax contributions into one year.

Appreciated Stock

With the stock market gains over the last two years, donating appreciated assets such as stock can have tremendous advantages. Donors can deduct gifts of stocks that have been held more than a year (long enough to qualify as long-term capital gains) at the fair market value, rather than at the purchase price.

The downside is that your deduction can offset only up to 30% of your AGI. If you donate stocks you have held for less than one year, you will receive a deduction for their cost basis, rather than fair market value. However, the deduction can offset up to 50% of AGI.

Often, donors may gift the stock with the biggest winnings, which maximizes savings on capital gains, and then buy back the same stock with cash — which in turn raises the cost basis. If you happen to own a stock or mutual fund for more than one year and do not have the cost basis, this holding can be ideal for donation to charity.

The chart below shows the difference between selling appreciated stock and then donating cash to charity, compared to gifting appreciated stock. Not only would the individual save on taxes, as the charity does not pay capital gains tax, but the charity would also receive additional monies!

This example is hypothetical and for illustrative purposes only. The example does not take into account any state or local taxes or the Medicare net investment income surtax. The tax savings shown is the tax deduction multiplied by the donor’s income tax rate (24% in this example) minus the long-term capital gains taxes paid.

IRA Qualified Charitable Distributions (QCD)

This is an option only for donors over the age of 70 1/2. Qualified Charitable Distributions allow individuals to donate up to $105,000 annually (up from $100,000 last year) directly from an IRA. Donor Advised Funds are excluded from this charitable donation; it must go to a qualified charity.

The QCD reduces the value of the IRA and does not count towards the donor’s taxable income. It also counts toward satisfying the annual required minimum distribution. In 2024, donors can also direct a one-time QCD of up to $53,000 to a charitable remainder trust or charitable gift annuity.

Donor Advised Fund (DAF)

Picture a donor advised fund as your family foundation, without the headache and administrative hassle of setting up a family foundation. A donor advised fund is a charitable account established at a public charity or community foundation that allows donors to recommend grants over time. The donor decides the timing of the donation, the charity that will receive the donation and the amount of the donation made from the DAF. The donor claims the tax deduction upon funding of the donor advised fund.

There is not a requirement that the DAF must distribute 5% of the fund each year, which may allow the DAF to grow, expanding the available dollars to donate to charities. Donor advised funds also can be a charity beneficiary of IRA assets.

Promo for an article called Here's Why Investors Should Keep Politics Out of the Portfolio.

At CD Wealth Management, charitable giving plays a significant part in our company’s culture. We believe in giving back to the community, with our time as well as our pocketbook. We support many causes in the Dallas/Fort Worth Metroplex and encourage our team members to get involved.

During the holiday season every year, we make a donation in each of our team members’ names to their charity of choice as a form of gratitude that also helps a great cause. It is part of who we are as a firm — and who we are as individuals. 

Please do not hesitate to reach out to us to discuss options to help you determine the best way to make the most of your charitable donations. Remember to visit the North Texas Giving Day website and look for your favorite charity. (Please note: all funding options above may not be available.)

The CD Wealth Formula

We help our clients reach and maintain financial stability by following a specific plan, catered to each client. 

Our focus remains on long-term investing with a strategic allocation while maintaining a tactical approach. Our decisions to make changes are calculated and well thought out, looking at where we see the economy is heading. We are not guessing or market timing. We are anticipating and moving to those areas of strength in the economy — and in the stock market. 

We will continue to focus on the fact that what really matters right now is time in the market, not out of the market. That means staying the course and continuing to invest, even when the markets dip, to take advantage of potential market upturns. We continue to adhere to the tried-and-true disciplines of diversification, periodic rebalancing and looking forward, while not making investment decisions based on where we have been.

It is important to focus on the long-term goal, not on one specific data point or indicator. Long-term fundamentals are what matter. In markets and moments like these, it is essential to stick to the financial plan. Investing is about following a disciplined process over time.

Sources: Fidelity, Schwab, Investopedia

The Fed’s Next Move: What Could Rate Cuts Mean for Investors?

Last week in Jackson Hole, Wyo., Fed Chair Jerome Powell gave the all-clear sign that the Federal Reserve is ready to begin cutting interest rates. The Fed has a mandate to foster economic conditions that achieve both stable prices and maximum sustainable employment.

Achieving price stability means inflation is tracking at the target 2% inflation rate, while maximum sustainable employment refers to the unemployment rate — the Fed has set a target of 4.1%. The current unemployment rate is 4.3%, above the Fed’s target.

Powell gave the following key messages at Jackson Hole:

• Inflation is under control and on a path back toward the Fed’s target rate of 2%.
• It’s time for monetary policy to adjust, meaning a long-awaited interest-rate cut at the Fed’s September meeting. The only question will be whether the cut is for 25 or 50 basis points.
• Instead of inflation, labor market conditions are now a top priority for the Federal Reserve.
• If we see further weakening in labor markets, the Fed will look to reduce rates further.

What does this mean for the market — and your pocketbook — now that the Fed has said rate cuts are on the horizon? From a stock market perspective, the Fed has had 14 cycles since 1929 in which it has started to cut interest rates. While not a huge sample statistically, this data still lets us look back and see how markets have performed.

Keeping in mind that past performance does not indicate future results, the S&P 500 has posted positive returns 12 months after the first rate cut 86% of the time. The two instances of negative returns do not resemble the current economic environment: the dot-com implosion and the subprime mortgage crisis. In the 12 times when the market was up, the average return was over 18%.

Why would the market typically go up following interest rate hikes?

Interest rates influence how stock prices and valuations are perceived. Interest rates can affect both price to earnings multiples (P/E) as well as valuations of future earnings. As rates come down, borrowing costs for companies go down, which in turn helps reduce costs and raises profit margins.

All else being equal, if profit margins are higher and costs lower, companies deserve a higher multiple, or P/E ratio, which in turn justifies higher stock prices. From a valuation perspective, a company’s future earnings are based on what is called discounted cash flows: looking at future cash flows and discounting those back to today’s dollars to come up with a price estimate.

If interest rates are lower, the rate to discount the cash flows is lower, in turn producing higher present values of future cash flows, leading to higher stock prices.

S&P 500 Return 12 Months After First Rate Cut

Chart showing the S&P 500 return 12 months after the first rate cut since 1929.
Sources: Charles Schwab, Bloomberg, the Federal Reserve. Data from 8/9/1929 through 7/31/2020. Indexes are unmanaged, do not incur management fees, costs and expenses, and cannot be invested in directly. Past performance is no guarantee of future results.

What do lower rates mean for your pocketbook?

Short-term investments like CDs, Treasury bills and money markets that have grown so much in popularity over the last two years will become less attractive. When the Fed cuts rates, it is cutting short-term rates. Money market rates will drop in tandem with the interest rate reductions.

If your money market fund has been earning 5% and the Fed cuts rates by 50 basis points, you should expect your money market to yield 4.5% after the rate cut. Investors will be faced with the question of what to do next as CDs, Treasuries and bonds mature while rates are going down.

Returns After Inflation, 1926-2023

Chart showing market returns after inflation from 1926 to 2023.
Sources: Morningstar 2024 and Precision Information, dba Financial Fitness Group 2024. Stocks are represented by the Ibbotson Large Company Stock Index, which tracks the monthly return of S&P 500. Bonds are represented by the 20-year U.S. government bond, cash by the U.S. 30-day Treasury bill minus inflation as shown by the Consumer Price Index. Assumes reinvestment of income and no transaction costs or taxes. Past performance is no guarantee of future results. This is for illustrative purposes only and not indicative of any investment.

Over the long term, cash has barely kept up with rising prices, while stocks and bonds have delivered average annual returns that have exceeded the rate of inflation. Cash is not a substitute for bonds, even though it helps with portfolio volatility.

Having too much cash creates its own risks, including not earning enough to cover future inflation — but also not providing enough protection against the inevitable downturn in stocks. Historically, when the economy slows and rates come down, attractive short-term rates also come down.

However, that doesn’t mean that longer-term yields will fall in tandem, and it may make sense to extend the duration or maturity of the current bond portfolio to lock in higher yields. While yields on newly issued bonds will come down along with interest rates, the interest or “coupon” that a bond pay remains unchanged until the bond matures or is redeemed by the issuer. That makes it possible for investors in longer-dated bonds to enjoy today’s relatively higher yields, even after rates come down.

Interestingly, bonds have been the only asset class since 1950 to produce double-digit returns during recessions. While the money market, CDs and short-term bonds still look attractive right now, the economy continues to grow, and we are not in a recession.

With the Fed likely to cut rates in September and then again in either November and/or December, investors who stay only in short-term investments may risk missing an opportunity to lock in higher yields. As bonds or CDs come due, it is important to continue to invest those monies into longer-dated maturities, depending on cash needs, to protect against future rate declines.

The CD Wealth Formula

We help our clients reach and maintain financial stability by following a specific plan, catered to each client. 

Our focus remains on long-term investing with a strategic allocation while maintaining a tactical approach. Our decisions to make changes are calculated and well thought out, looking at where we see the economy is heading. We are not guessing or market timing. We are anticipating and moving to those areas of strength in the economy — and in the stock market. 

We will continue to focus on the fact that what really matters right now is time in the market, not out of the market. That means staying the course and continuing to invest, even when the markets dip, to take advantage of potential market upturns. We continue to adhere to the tried-and-true disciplines of diversification, periodic rebalancing and looking forward, while not making investment decisions based on where we have been.

It is important to focus on the long-term goal, not on one specific data point or indicator. Long-term fundamentals are what matter. In markets and moments like these, it is essential to stick to the financial plan. Investing is about following a disciplined process over time.

Sources: CNBC, Fidelity, Morningstar, Schwab

Promo for article called The Market's Recovery Puts August Pullback in the Rearview Mirror.

This material contains an assessment of the market and economic environment at a specific point in time and is not intended to be a forecast of future events, or a guarantee of future results. Forward-looking statements are subject to certain risks and uncertainties. Actual results, performance, or achievements may differ materially from those expressed or implied. Information is based on data gathered from what we believe are reliable sources.

Using diversification as part of your investment strategy neither assures nor guarantees better performance and cannot protect against loss of principal due to changing market conditions.

Past performance is not a guarantee of future results.

The opinions expressed in this commentary are those of the author and may not necessarily reflect those held by Kestra Investment Services, LLC or Kestra Advisory Services, LLC. This is for general information only and is not intended to provide specific investment advice or recommendations for any individual. It is suggested that you consult your financial professional, attorney, or tax advisor with regard to your individual situation.

Securities offered through Kestra Investment Services, LLC (Kestra IS), member FINRA/SIPC. Investment Advisory Services offered through Kestra Advisory Services, LLC (Kestra AS) an affiliate of Kestra IS. CD Wealth Management and Bluespring Wealth Partners LLC* are affiliates of Kestra IS and Kestra AS.  Investor Disclosures: https://bit.ly/KF-Disclosures

*Bluespring Wealth Partners, LLC acquires and supports high quality investment adviser and wealth management companies throughout the United States.

Fidelity Investments and Fidelity Institutional® (together “Fidelity”) is an independent company, unaffiliated with Kestra Financial or CD Wealth Management. Fidelity is a service provider to both. There is no form of legal partnership, agency affiliation, or similar relationship between your financial advisor and Fidelity, nor is such a relationship created or implied by the information herein. Fidelity has not been involved with the preparation of the content supplied by CD Wealth Management and does not guarantee, or assume any responsibility for, its content. Fidelity Investments is a registered service mark of FMR LLC. Fidelity Institutional provides clearing, custody, or other brokerage services through National Financial Services LLC or Fidelity Brokerage Services LLC, Members NYSE, SIPC.

The Market’s Recovery Puts August Pullback in the Rearview Mirror

Last week, stocks had their best week of the year. The S&P 500 rose eight days in a row, the first eight-day streak since November. In the last four years that saw an eight-day win streak, the average return was over 26% for the year.

As of now, the S&P 500 is up almost 18% through mid-August.

It wasn’t that long ago that the stock market saw a pullback that led some investors to a mild freak-out in anticipation of a worst-case scenario. The headlines were dominated by fears of a recession, the Fed being behind the curve on interest rate cuts and the yen carry trade ending.

Two weeks later, stocks are back near all-time highs, led by a broad-based rally of small caps, large-cap stocks, mega-cap stocks and international stocks. A run of favorable economic data across producer price index (PPI), consumer price index (CPI), retail sales and jobless claims is driving the rally.

More often than any other month, August is when we tend to see these types of out-of-the-blue events.

As the chart shows, this year saw the seventh-largest August crisis that caused extreme fear and volatility since 1990. The good news: Investors got through all of them, and we don’t expect this time — or the next time — to be any different.

Even the best years in the market have bad days and scary headlines. Does this mean that we are completely out of the woods with regards to market weakness or volatility? Not at all; the months leading up to elections often can be volatile.

There’s Something About August

S&P 500 returns in volatile Augusts (1990-present)

Chart showing S&P 500 returns in volatile Augusts (1990-present).
Source: Carson Investment Research, FactSet 8/9/24 (1990-present)

The last few weeks have been a good reminder of the adage that what matters is time in the market and not timing the market. The worst time to sell is in a market panic, no matter how long or brief that panic may be. If you get scared and decide to get out of the market, you probably will miss some of the best days of the year.

If you had invested $10,000 into the S&P 500 in 2004 and stayed invested over that entire time, the investment would be worth almost $64,000. If you tried to time the market or got scared and got out during one of the above August scares, and you missed the best 10 days, the return would be less than half that total. It gets worse from there.

What we see so often is that once an investor decides to sell out of the market, it becomes very difficult to get back in.

Fear takes over, and you think that the market can only go one direction — down. Fearful investors assume that even if the market bounces, they can’t get back in as they were by buying back in at a higher level than where they sold.

If you wait to get more clarity or less uncertainty, you will probably miss the best days — and that will cost you in the long run.

Time In the Market, Not Timing the Market

Performance of $10,000 invested in the S&P 500 the past 20 years (2004-2023)

Chart showing the performance of $10,000 invested in the S&P 500 the past 20 years (2004-2023).
Source: Carson Investment Research, JPMorgan Asset Management

The current economy’s underlying fundamentals are sound, but a large disconnect remains between the stock market, the economy and people’s sentiments about the economy. The job market has started to cool off since the remarkable strength of the pandemic. The number of job openings continues to trend downward.

Inflation has cooled significantly, but not quite to the level that the Fed wants to see. What’s more, consumer prices are still higher than they were several years ago, and people continue to feel it in their pocketbooks. Food prices have risen more than 25% since January 2020.

It also costs more to borrow money today than it used to. We became used to low interest rates for homes and credit cards. High rates combined with higher home prices have made buying a home much harder.

Finally, most people who are invested in stocks are invested through their 401K or retirement accounts. The growth in the market is not helping those individuals with increased costs of living, which may be why most don’t feel so great about the current economy even as the market hits new highs.

It is so important to keep your eye on the prize and focus on the big picture; economic growth remains strong, and the real economy continues to grow, which in turn, fuels the market to move higher.

The CD Wealth Formula

We help our clients reach and maintain financial stability by following a specific plan, catered to each client. 

Our focus remains on long-term investing with a strategic allocation while maintaining a tactical approach. Our decisions to make changes are calculated and well thought out, looking at where we see the economy is heading. We are not guessing or market timing. We are anticipating and moving to those areas of strength in the economy — and in the stock market. 

We will continue to focus on the fact that what really matters right now is time in the market, not out of the market. That means staying the course and continuing to invest, even when the markets dip, to take advantage of potential market upturns. We continue to adhere to the tried-and-true disciplines of diversification, periodic rebalancing and looking forward, while not making investment decisions based on where we have been.

It is important to focus on the long-term goal, not on one specific data point or indicator. Long-term fundamentals are what matter. In markets and moments like these, it is essential to stick to the financial plan. Investing is about following a disciplined process over time.

Sources: Carson, Fidelity, JP Morgan, Opco

Promo for an article titled Turning Investment Losses into Gains: The Art of Tax-Loss Harvesting.

This material contains an assessment of the market and economic environment at a specific point in time and is not intended to be a forecast of future events, or a guarantee of future results. Forward-looking statements are subject to certain risks and uncertainties. Actual results, performance, or achievements may differ materially from those expressed or implied. Information is based on data gathered from what we believe are reliable sources.

Using diversification as part of your investment strategy neither assures nor guarantees better performance and cannot protect against loss of principal due to changing market conditions.

Past performance is not a guarantee of future results.

The opinions expressed in this commentary are those of the author and may not necessarily reflect those held by Kestra Investment Services, LLC or Kestra Advisory Services, LLC. This is for general information only and is not intended to provide specific investment advice or recommendations for any individual. It is suggested that you consult your financial professional, attorney, or tax advisor with regard to your individual situation.

Securities offered through Kestra Investment Services, LLC (Kestra IS), member FINRA/SIPC. Investment Advisory Services offered through Kestra Advisory Services, LLC (Kestra AS) an affiliate of Kestra IS. CD Wealth Management and Bluespring Wealth Partners LLC* are affiliates of Kestra IS and Kestra AS.  Investor Disclosures: https://bit.ly/KF-Disclosures

*Bluespring Wealth Partners, LLC acquires and supports high quality investment adviser and wealth management companies throughout the United States.

Fidelity Investments and Fidelity Institutional® (together “Fidelity”) is an independent company, unaffiliated with Kestra Financial or CD Wealth Management. Fidelity is a service provider to both. There is no form of legal partnership, agency affiliation, or similar relationship between your financial advisor and Fidelity, nor is such a relationship created or implied by the information herein. Fidelity has not been involved with the preparation of the content supplied by CD Wealth Management and does not guarantee, or assume any responsibility for, its content. Fidelity Investments is a registered service mark of FMR LLC. Fidelity Institutional provides clearing, custody, or other brokerage services through National Financial Services LLC or Fidelity Brokerage Services LLC, Members NYSE, SIPC.